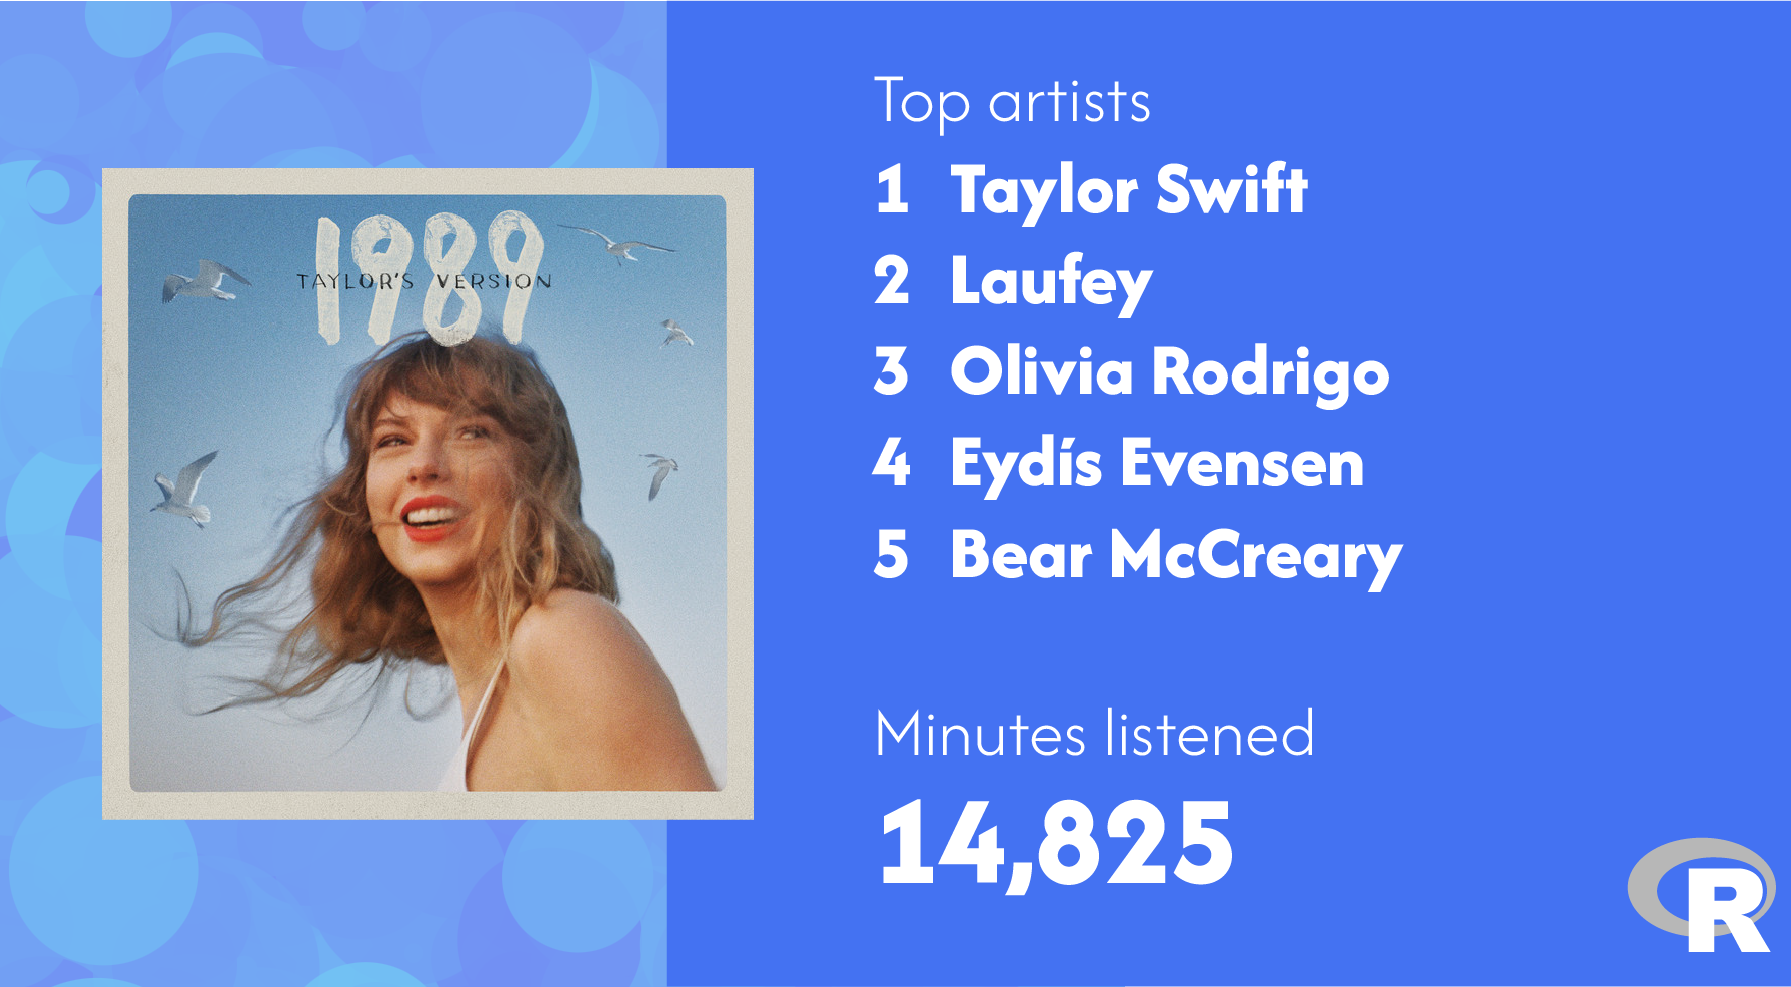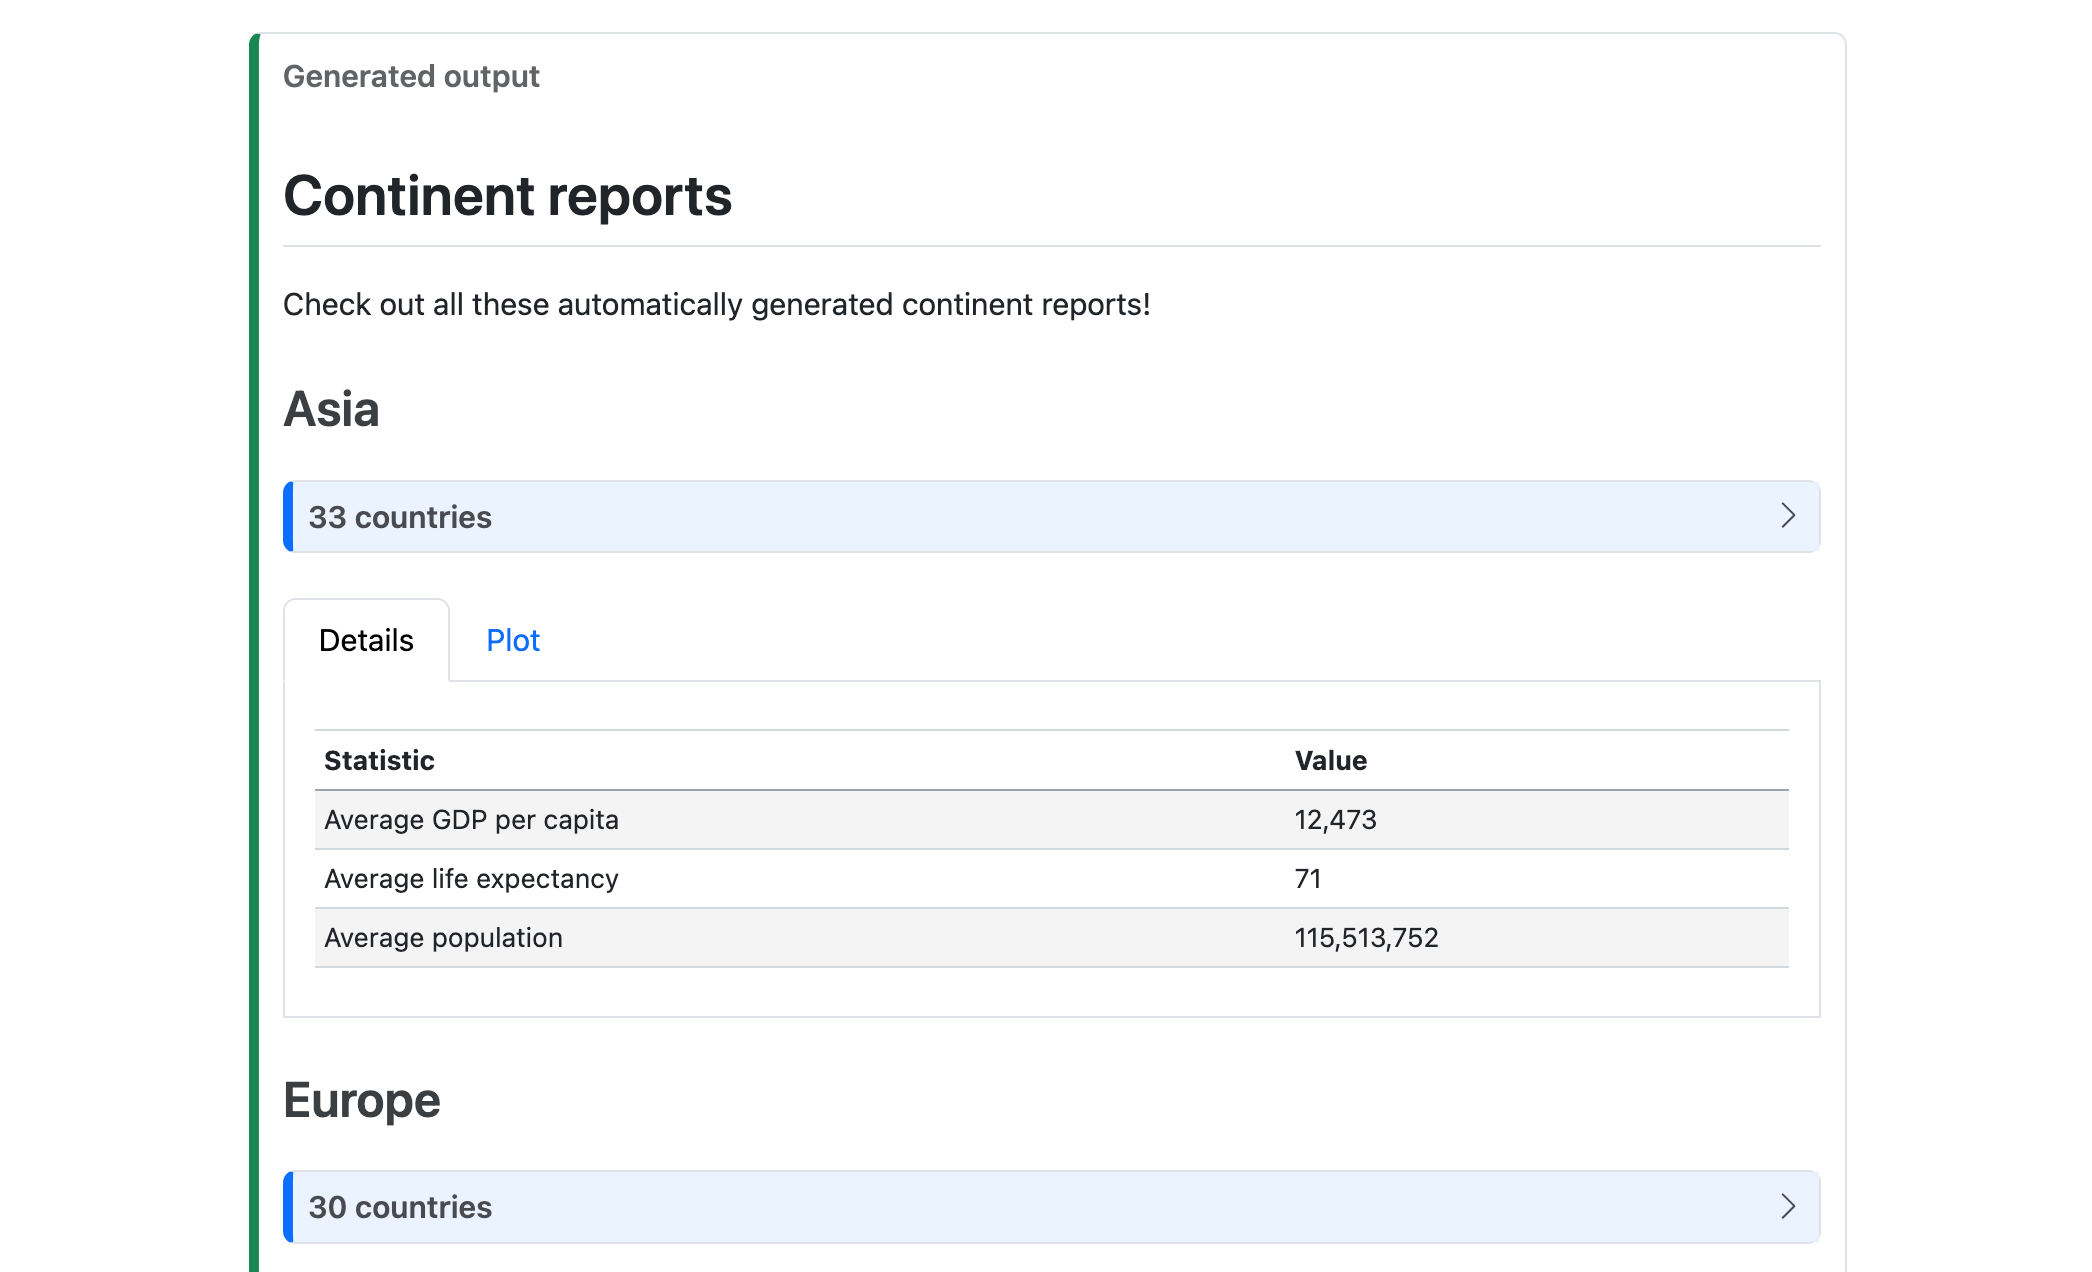
’Tis the season for Spotify Wrapped stats and I love it, both for seeing what everyone listens to and because it’s such a cool way of presenting data.
This year, I’ve helped build the Idaho Secretary of State’s office’s election results website for both the primary and general elections. Working with election data is a complex process, with each precinct reporting results to their parent counties, which all use different systems and software and candidate identifiers.
At the end of June 2024, Posit released a beta version of its next-generation IDE for data science: Positron. This follows Posit’s general vision for language-agnostic data analysis software: RStudio PBC renamed itself to Posit PBC in 2022 to help move away from a pure R focus, and Quarto is pan-lingual successor to R Markdown.
A few days ago, my wife, a bunch of my kids, and I were huddled around a big wall map of the United States, joking about the relative unimportance of Rhode Island, the smallest state in the US. It’s one of the states I never ever think about: …and it’s just so small . Amid the joking, my wife came to Rhode Island’s defense by declaring that even though it’s so small, it has one of the highest proportions of coastline to land borders.
Even though I’ve been teaching R and statistical programming since 2017, and despite the fact that I do all sorts of heavily quantitative research, I’m really really bad at probability math . Like super bad. The last time I truly had to do set theory and probability math was in my first PhD-level stats class in 2012.
I’ve used Garrick Aden-Buie’s tidyexplain animations since he first made them in 2018. They’re incredibly useful for teaching—being able to see which rows left_join() includes when merging two datasets, or which cells end up where when pivoting longer or pivoting wider is so valuable.
In my causal inference class, I spend just one week talking about the Rubin causal model and potential outcomes.
Complete tutorial and code See the full tutorial here. You can also see the tutorial’s code here and the code for the final API here.
tl;dr If you want to skip the explanation and justification for why you might want separate bibliographies, you can skip down to the example section, or just go see some example files at GitHub. Why use separate bibliographies? In academic articles, it’s common to have a supplemental appendix with extra tables, figures, robustness checks, additional math, proofs, and other details.
I’ve been finishing up a project that uses ordered Beta regression (Kubinec 2022), a neat combination of Beta regression and ordered logistic regression that you can use for modeling continuous outcomes that are bounded on either side (in my project, we’re modeling a variable that can only be between 1 and 32, for instance). It’s possible to use something like zero-one-inflated Beta regression for outcomes like this, but that kind of model