setupsource(here::here("_defaults.R")) library(tidyverse) library(brms) library(broom.mixed) library(ggdist) library(tidybayes) library(marginaleffects) library(tinytable) library(patchwork) library(faux) set.seed(2025-12-8) options(tinytable_html_mathjax = TRUE) I’ve been thinking about Causal Inference, and have run up against a kind of confusing issue when it comes to “Composite Variables”, or variables deterministically created from the

I recently gave a talk about analyzing vowel formant trajectories using the Discrete Cosine Transform, and people have been asking me about when they could/should use a DCT based model versus a gamm. So, I’ll work through that question here!

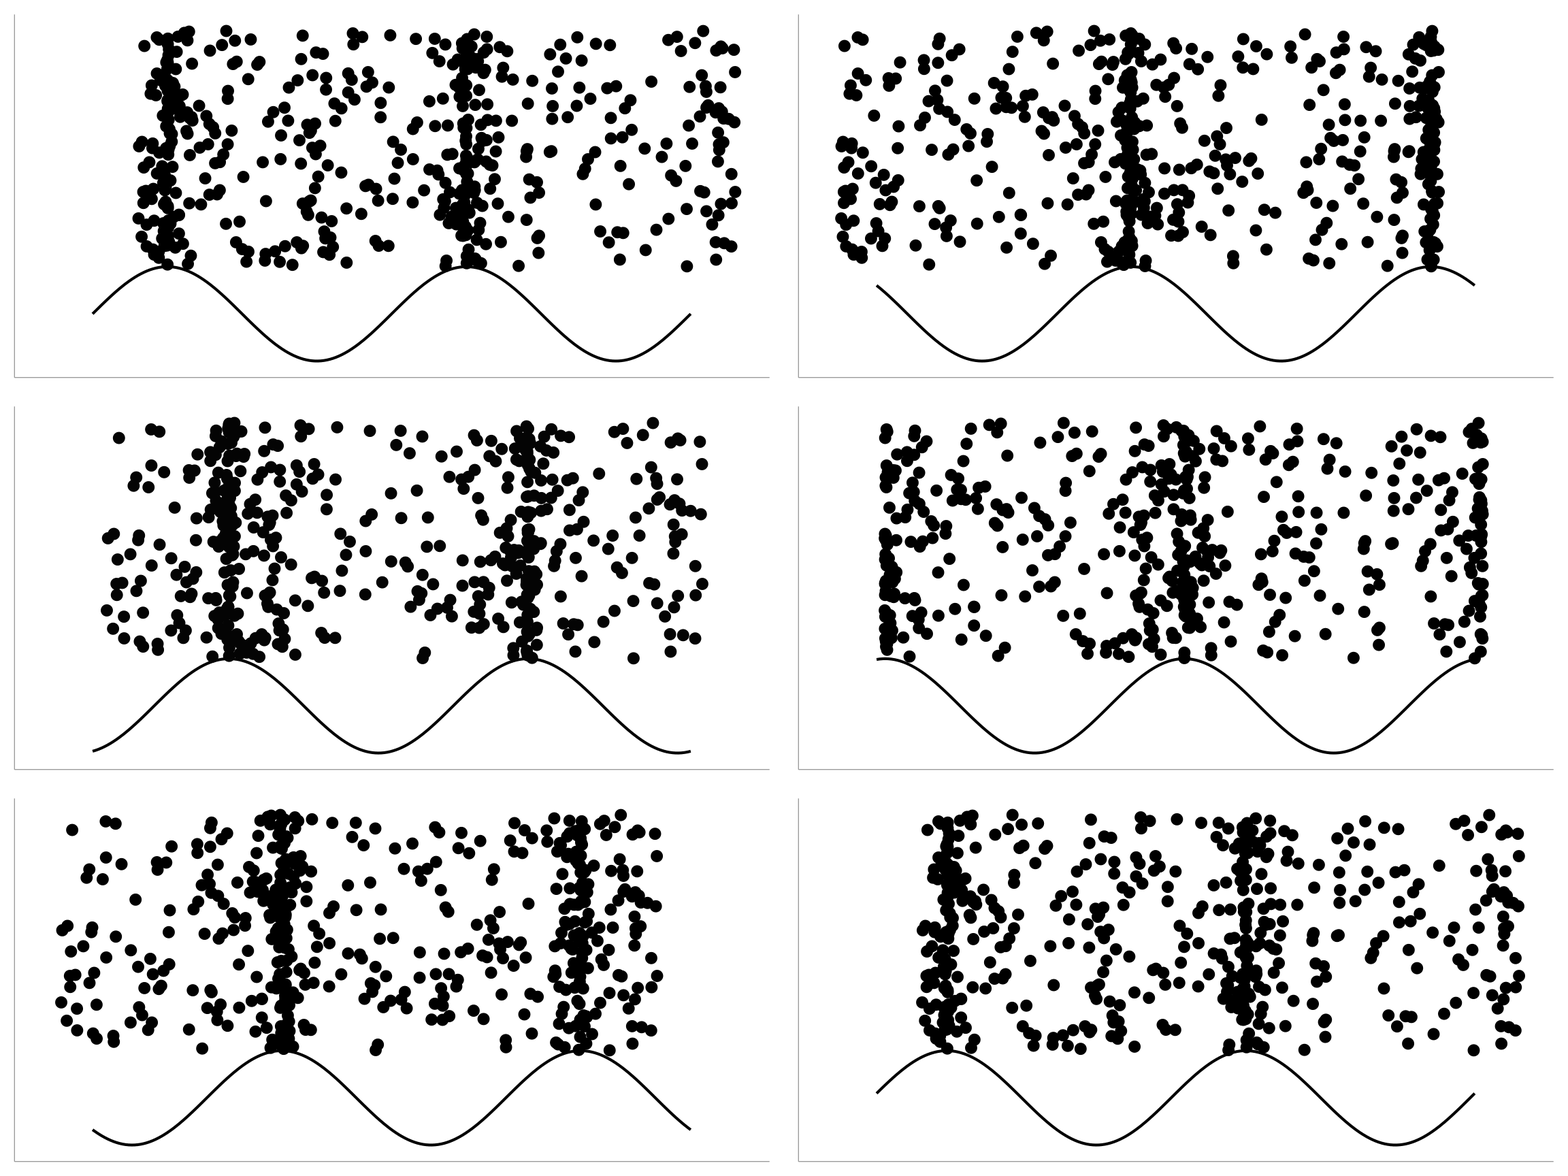
I’ve been teaching phonetics for the first time in a while, and I wanted to make some animations illustrating how sounds are pressure waves in propagating through the air. I worked how how to do this in a fairly tidy way, again leveraging the new stat_manual() from ggplot2, and gganimate.
I’m currently running a D&D campaign, and in a recent session we ended with the plan for the party to interrogate a character they’d captured. We play every other week, which meant I had two whole weeks to figure out what exactly this character knew. I was worried about a few things though.

Following on from my post about darkmode in ggplot2 4.0, I wanted to also mess around with the new stat_manual() that’s available. And folks, it’s good! source(here::here("_defaults.R")) library(tidyverse) library(tidynorm) library(scales) The announcement blog post says Let’s put it to the test! Plotting sine waves I’m teaching Phonetics this semester, so I’ve got sine waves on the mind.

Back in April, Quarto v1.7 introduced the ability to display multiple outputs from a single code chunk depending on whether or not the side is in dark mode. This was really exciting for me, because even though I prefer to keep sites in dark mode for personal use, I’ve found that in some presentation and teaching settings, the projector and lighting conditions make dark mode illegible.
Note This is a version of the AI course policy I’m introducing this semester. 🚫 When in doubt: No. There is no aspect of this course for which it is recommended, appropriate, or acceptable to turn to a Large Language Model (more commonly called an AI) such as ChatGPT. This includes: Working on graded assignments, quizzes, or discussion prompts. As a supplement to the readings or course notes.
I just saw a really interesting paper by Scott Nelson and Jeffrey Heinz (Nelson and Heinz 2025) that proposes a model of phonology and phonetics as complex function application that maintains a discrete phonology while also alowing for things like incomplete neutralization. I myself am always sort of able to follow formal notation, but get a better understanding if I try rewriting it in a programming language of some sort.
I’m not sure when I first came across his stuff, but I’ve really admired Andrew Heiss’ public scholarship, including his blog, which is full of handy stuff. At some point I noticed he had post-level DOIs minted. I knew you could mint repository-level DOIs with GitHub and Zenodo, but maintaining each post as a repository and adding them as submodules to a blog is… a lot.

I had a lot of fun working with the XKCD color survey data, and I think I’ll keep messing around with it here and there in the future. But I also think I’ll want access to the full data. The tidytuesday data set was necessarily boiled down. The answers data frame contained just one hex code associated with one color label, not every color label given to every hex code in the survey.
So now I can finally get to visualizing the effect of “light” and other modifiers on colors! When I eventually get to the plotly code, there’s nothing tidy going on, so I’ll be code-folding most of this stuff.