In-person science meetings are returning. It’s a sad fact that during the pandemic, we failed to make virtual events work as a complete replacement for in-person meetings. Despite it being clear that online meetings solve many of the accessibility and sustainability issues that surround in-person events, there’s an appetite for things to return to the way they were. For better or for worse. So what went wrong?

A new paper means a new paper explainer. This post is all about our new paper on clathrin assembly. Some background info Endocytosis is the way that cells take up material from the outside world.
We have a new paper out! This post is to describe what our paper is about. The paper is free to read, so please take a look if you are interested.

There are perennial topics of discussion on Science Twitter. An example of this is: should figures be at the end of a manuscript are interspersed in the text. These topics tend not to be resolved because there are strong arguments (and personal preferences) on each side.

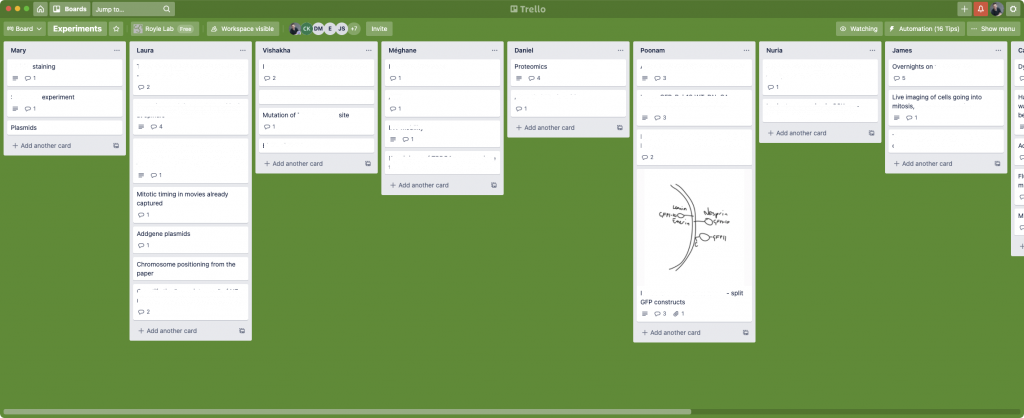
Back in 2015, I wrote a guide to using Trello for lab organisation. I figured it was time for an update because a few things have changed since then and the topic of using Trello for larger labs came up on Twitter. Note that other kanban-style software is available.
PhD students sometimes get the same bad advice on writing their thesis. I call this advice the Rule of Three. Typically, they get told that their thesis: Will take 3 months to write Should have 3 results chapters Should be 300 pages These bits of advice have one thing in common: they are all wrong.
If I struggle to find the answer to something, it must be worth a post to help out others. So, here’s where to find the php.ini file on a standard WordPress install on Raspberry Pi. I installed a LAMP stack and WordPress on a Raspberry Pi following these excellent instructions.

The Retropie project is a wonderful way to play retro games on a Raspberry Pi (see previous post). A number of handheld units are available to make a convincing retro gaming experience. One of these is the Retroflag GPi case, modelled on Nintendo’s Game Boy.

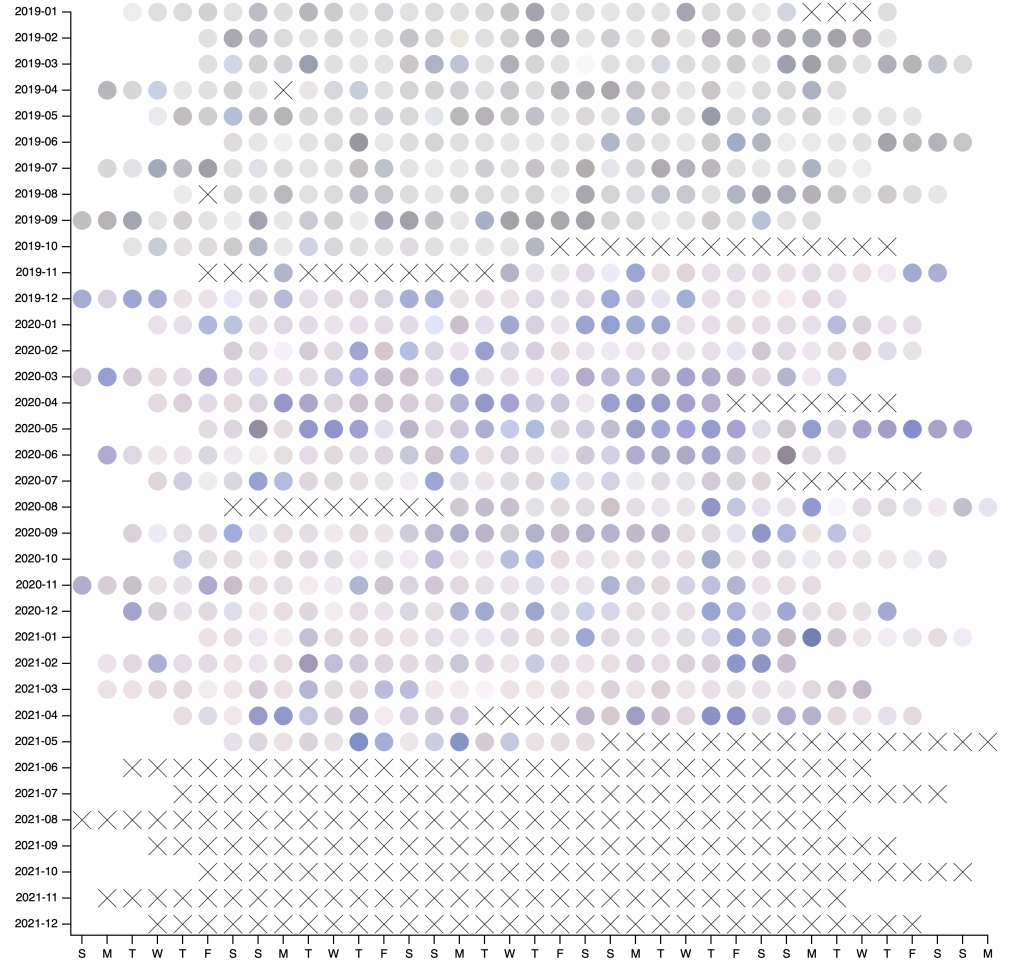
I have a long-running project Raspberry Pi project to make time-lapse movies of a countryside view (see previous posts). It’s been running for over two years and the results are great.

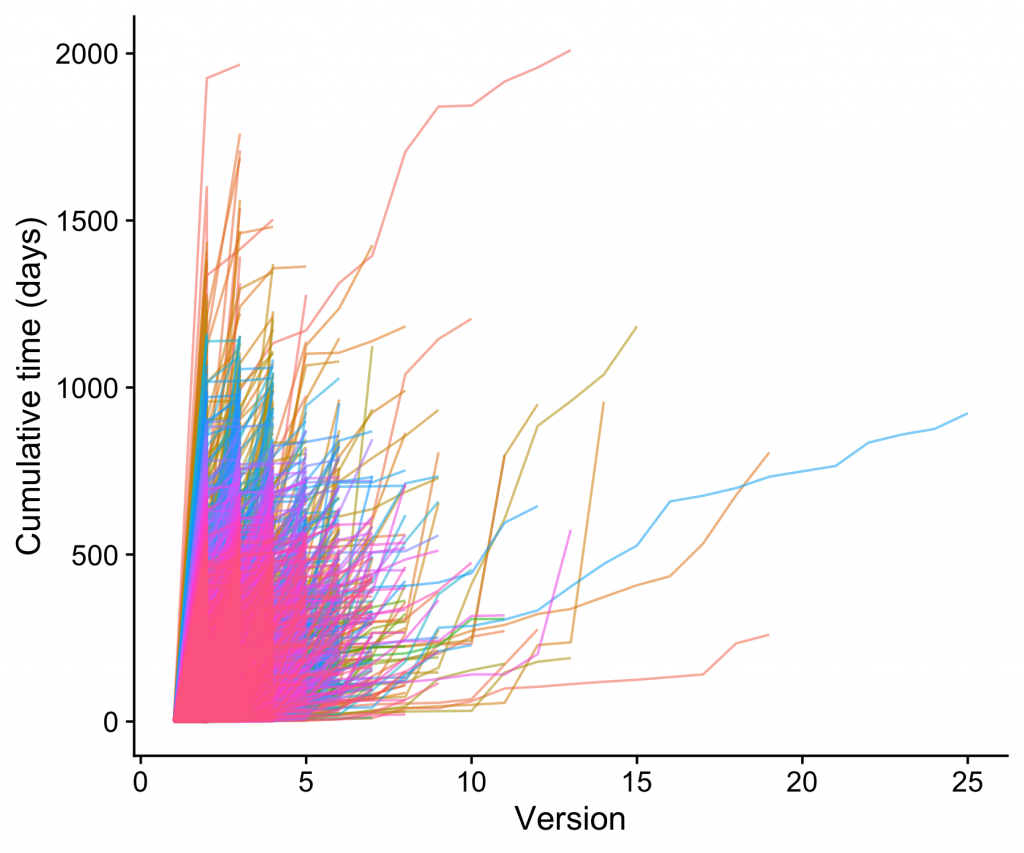
The aim of this post is to look at revisions of bioRxiv preprints. I’m interested how long preprint versions exist on bioRxiv. In other words: how long do revisions to preprints take? The data from bioRxiv is a complex dataset with many caveats as I’ll explain further down, but some interesting details do emerge.

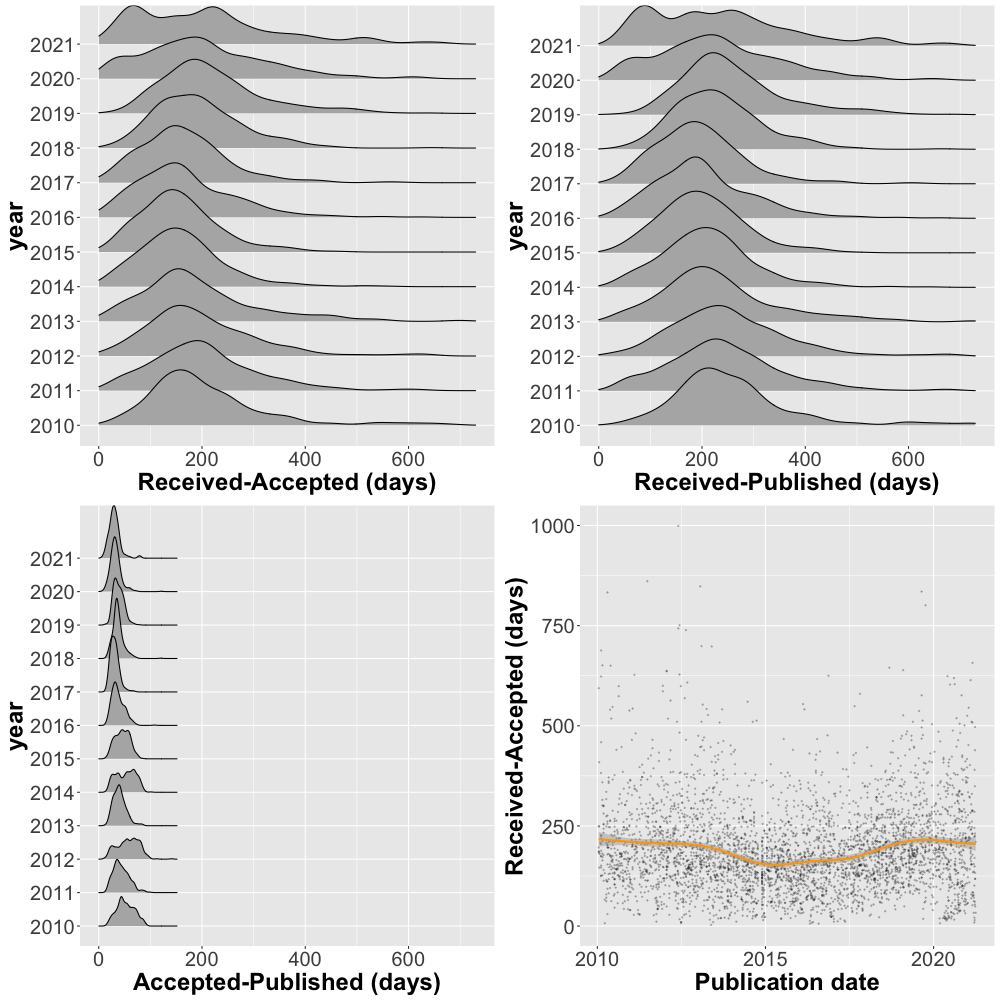
This post is an update of a previous analysis on quantixed. We have covered publication lag times – the time it takes for a paper go from submitted (received) to accepted and published – a lot on here. It is possible to look at lag times, in R using data from PubMed.