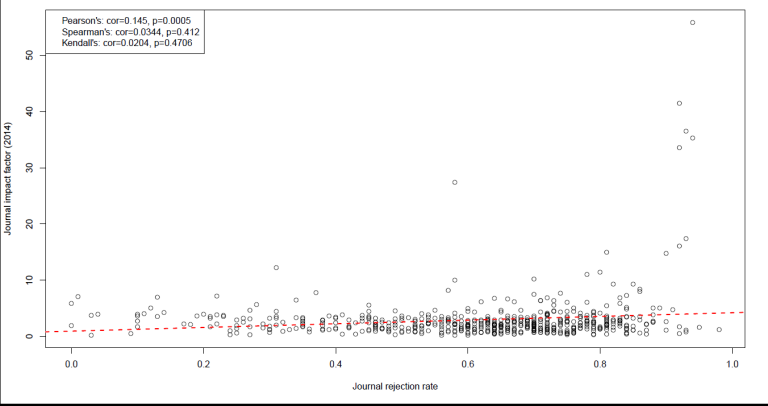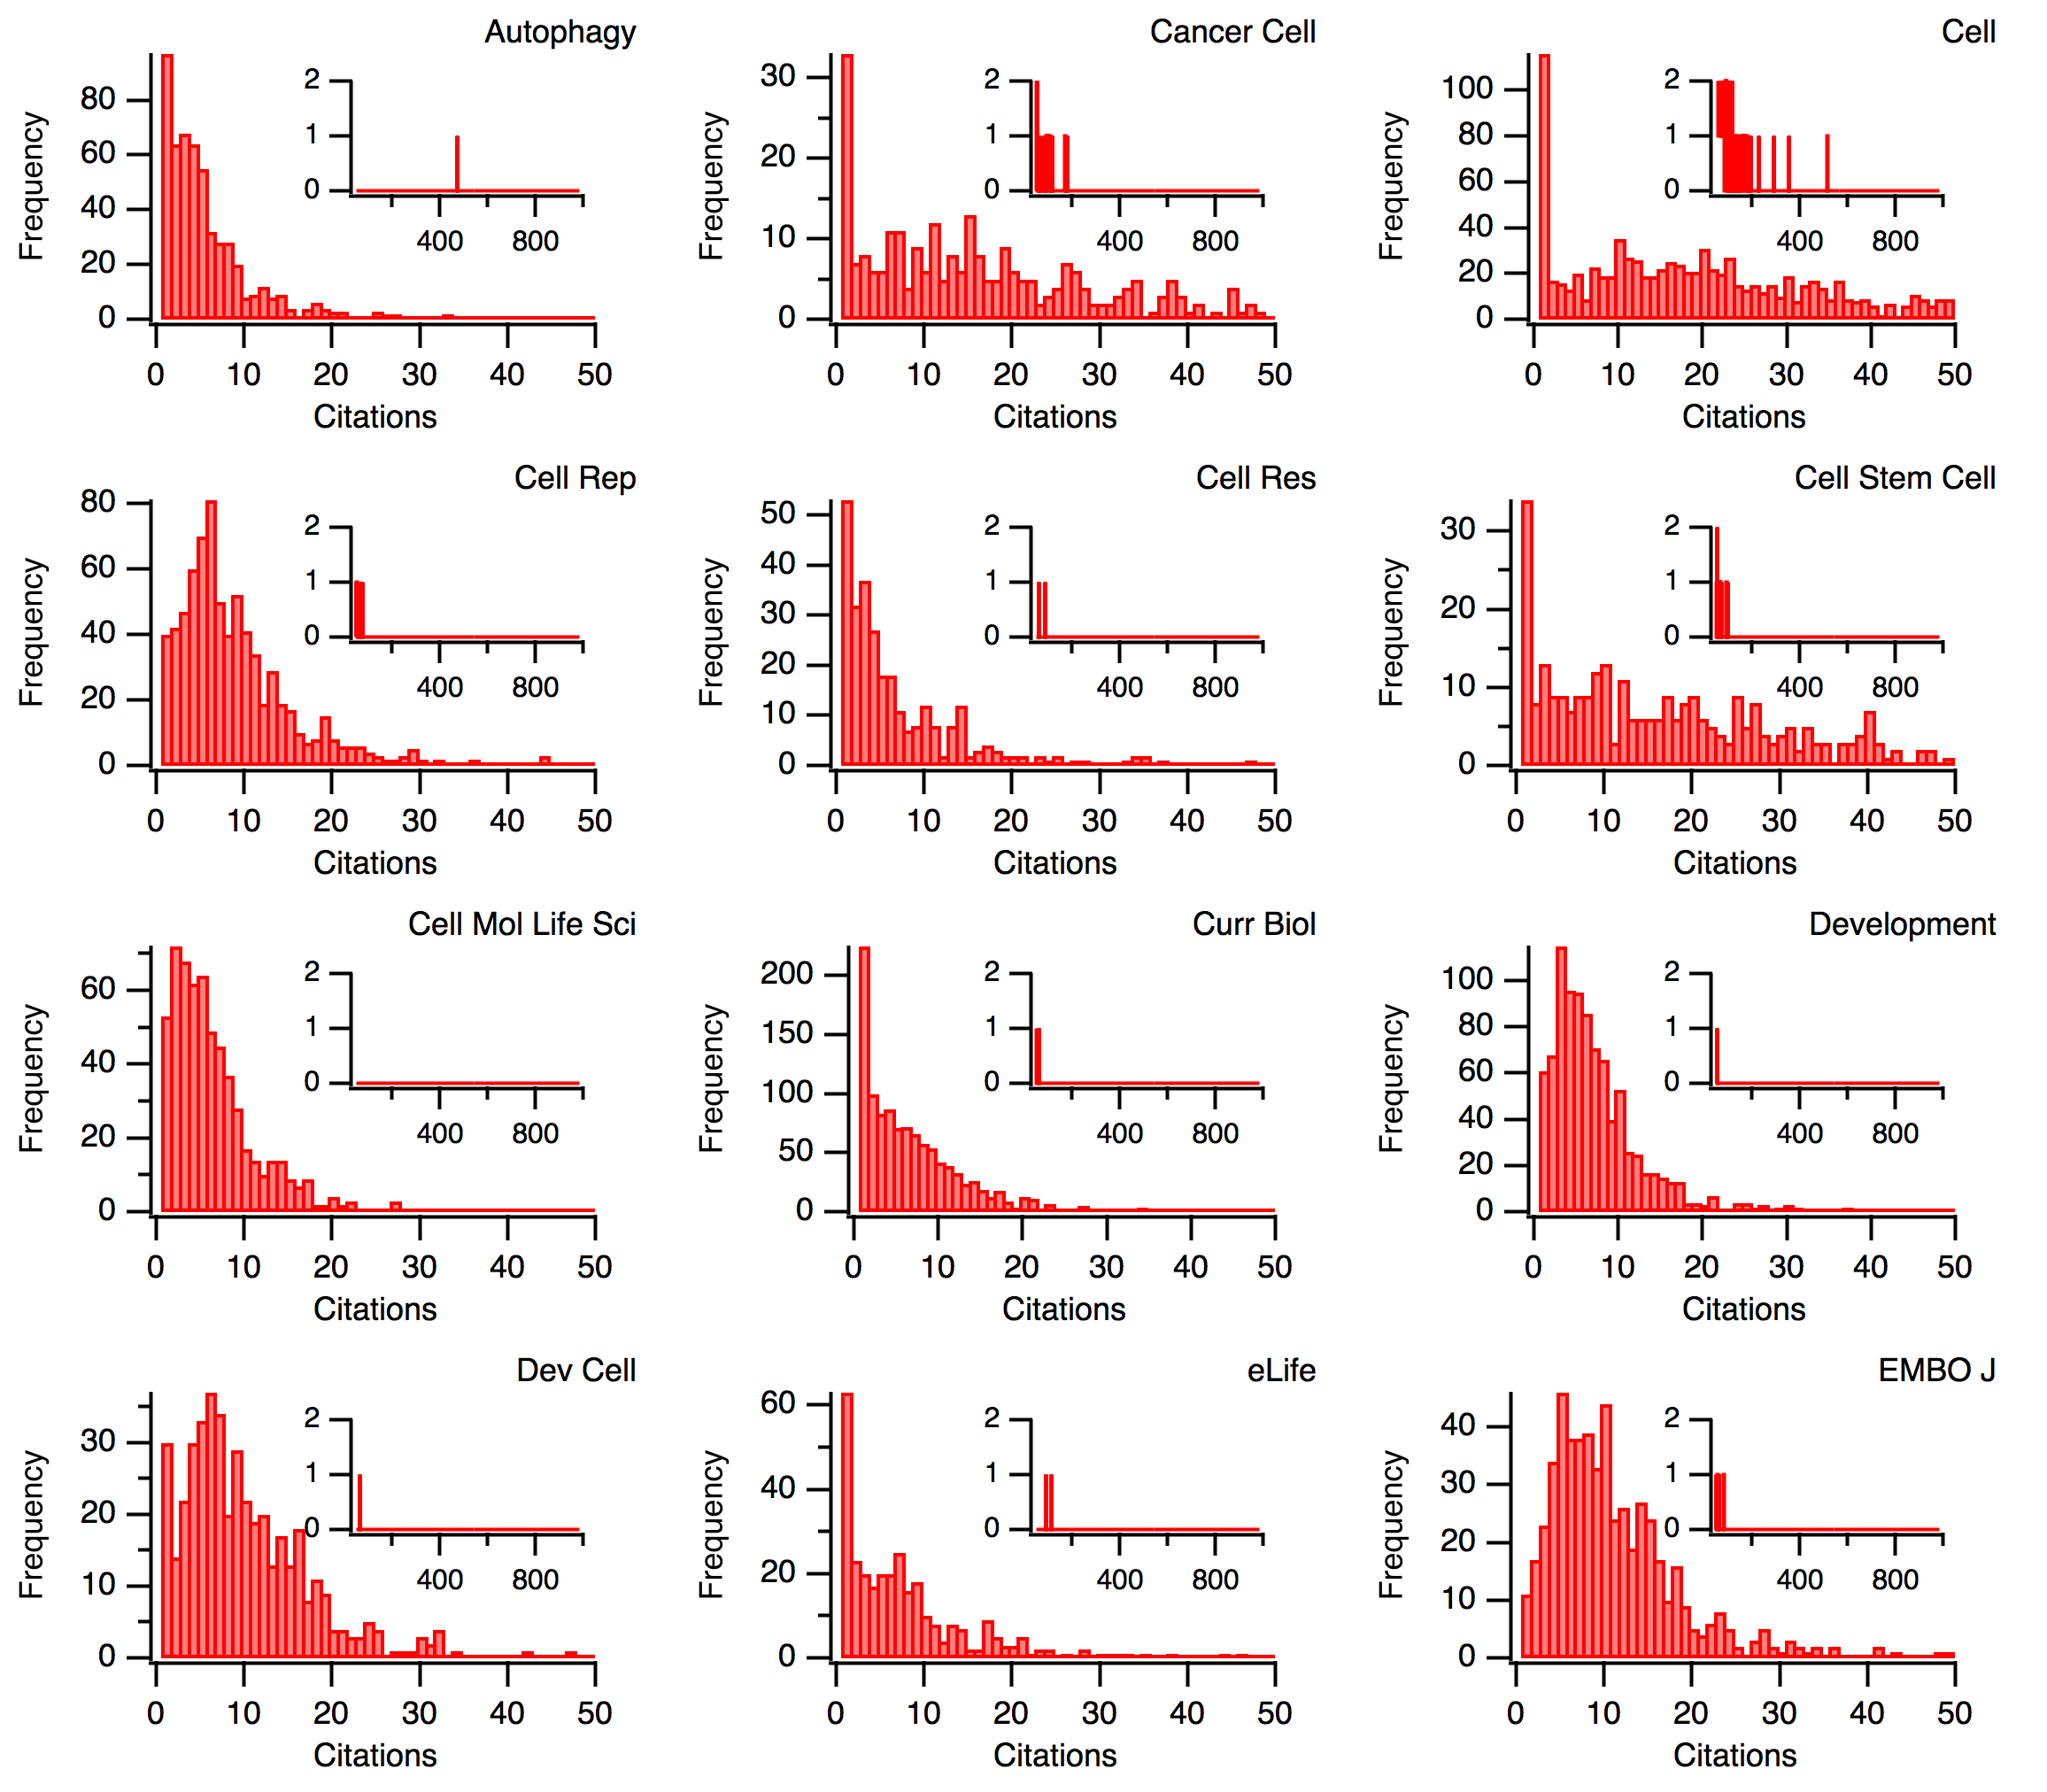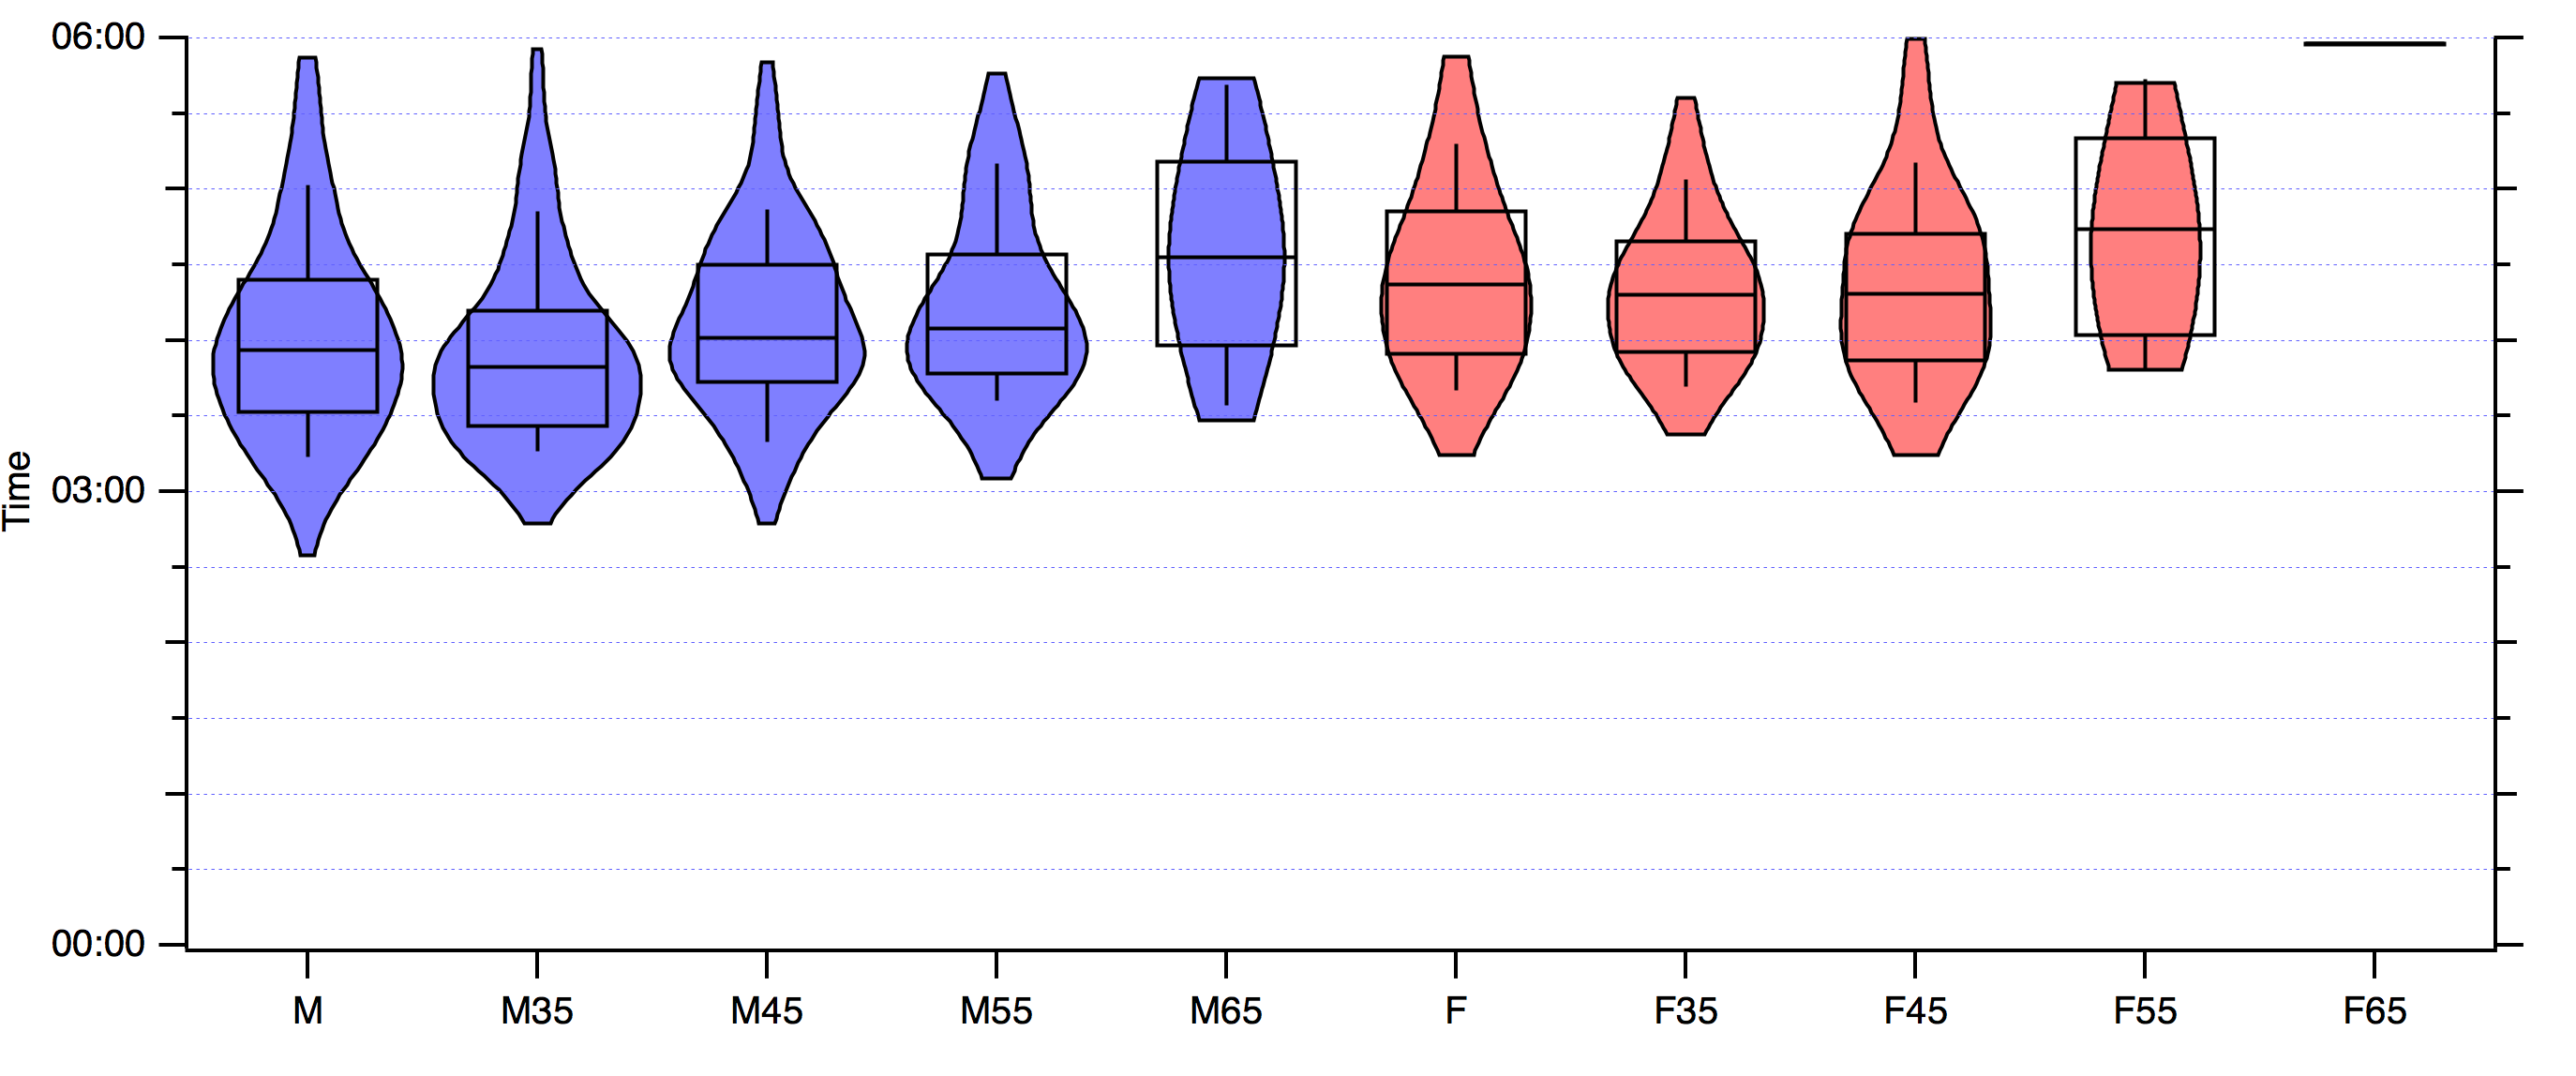
This post follows on from a previous post on citation distributions and the wrongness of Impact Factor.
This is just a quick tip as it took me a little while to sort this out. In the lab we have two QNAP TS-869 Pro NAS devices. Each was set up with a single RAID6 storage pool and I ran them as a primary and replicant via rsync. We recently bought a bigger server and so the plan was to repurpose one of the NAS boxes to be a Time Machine for all the computers in the lab.
In the lab we have been doing quite a bit of analysis of cell migration in 2D. Typically RPE1 cells migrating on fibronectin-coated glass. There are quite a few tools out there to track cell movements and to analyse their migration. Naturally, none of these did quite what we wanted and none fitted nicely into our analysis workflow. This meant writing something from scratch in IgorPro. You can access the code from my GitHub pages.
I’ve previously written about analysing my iTunes library and about generating Smart Playlists in iTunes. This post takes things a bit further by generating a “perfect playlist” outside of iTunes… it is exclusively for nerds . How can you put together a perfect playlist? What are your favourite songs? How can you tell what they are?
I’m putting this up here in case it is useful for somebody. We capture Z-stacks on a Perkin Elmer Spinning Disk microscope system. I wanted to turn each stack into a single image so that we could quickly compare them. This simple macro does the job. We import the images straight from the *.mvd2 library using the wonderful BioFormats import tool. We open all files as composite hyperstacks.
{.alignright .size-medium .wp-image-551 loading=“lazy” decoding=“async” attachment-id=“551” permalink=“https://quantixed.org/jcbdiet/” orig-file=“https://i0.wp.com/quantixed.org/wp-content/uploads/2015/07/jcbdiet.jpg?fit=603%2C2586&ssl=1” orig-size=“603,2586” comments-opened=“1”
{.alignright .size-medium .wp-image-547 loading=“lazy” decoding=“async” attachment-id=“547” permalink=“https://quantixed.org/doctopdf/” orig-file=“https://i0.wp.com/quantixed.org/wp-content/uploads/2015/07/doctopdf.png?fit=734%2C574&ssl=1” orig-size=“734,574” comments-opened=“1”
I was searching for the excitation and emission spectra for mNeonGreen. I was able to find an image, but no values for the spectra.
I recently gave a talk at a retreat for new PIs working at QMUL. My talk was focussed on tips for getting started, i.e. the nitty gritty of running an efficient lab. It was a mix of things I’ve been told, worked out for myself or that I’d learned the hard way. PIs are expected to be able to do lots of things that can be full-time jobs in themselves.