Open access to research data is becoming increasingly important, as manifested by memos or press releases from the Wellcome Trust, the European Commission, and the the Office of Science and Technology Policy (OSTP) from the White House.

Open access to research data is becoming increasingly important, as manifested by memos or press releases from the Wellcome Trust, the European Commission, and the the Office of Science and Technology Policy (OSTP) from the White House.
Yesterday we created a set of roughly 10,000 DOIs for journal articles published in 2011 or 2012. We used these DOIs as a reference set in a data hackathon around article-level metrics/altmetrics - material for another blog post. The random DOis were generated using the CrossRef RanDOIm service, with article titles fetched from the CrossRef OpenURL API.

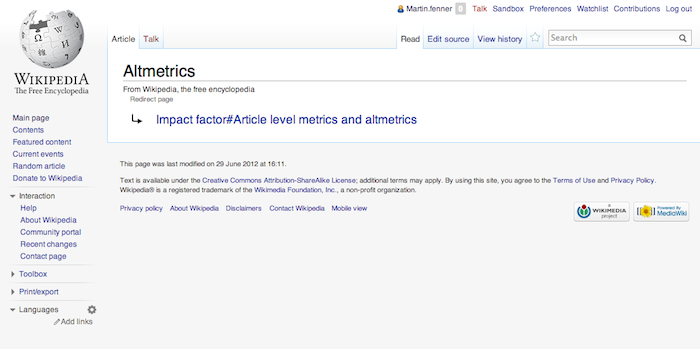
Ten days ago Information Standards Quarterly (ISQ) published a special issue on altmetrics. I was the guest editor for the five altmetrics articles, and in the editorial that I titled Altmetrics have come of age I argued that We no longer need to talk about whether it is possible to reliably collect altmetrics, or whether this is valuable information that can complement citations and usage statistics.
According to the description on the Citation Style Language (CSL) website, CSL is an open XML-based language to describe the formatting of citations and bibliographies.
Now that I can automatically import my publications from my ORCID profile and display them in this blog, I also want to visualize them. I have started with d3.js code that displays the number of publications per year - using the list of my publications in Citeproc JSON format.
A common feature of blogs written by scientists is a listing of all their publications. Publication lists are a great way to provide background information about your research. Publication lists should provide links to the fulltext versions of these publications, should be nicely formatted - e.g. using a common citation style such as APA - and should be easy to maintain.

The standard local file formats for bibliographic data are probably bibtex and RIS. They have been around for a long time, and are supported by all reference managers and many other tools and services.
Open Researcher & Contributor ID (ORCID) provides a persistent identifier for researchers and lets them claim their research outputs in the ORCID Registry. I have been involved with ORCID since early 2010 and I am happy to see that nine months after launch 200,000 researchers have signed up for the service, and the organization has more than 70 member organizations.

A keynote is a presentation typically given at a start of a conference that sets the central theme for the event. A keynote speaker usually has more time (45-60 min) than other presenters, and has the full attention of everyone attending the conference.
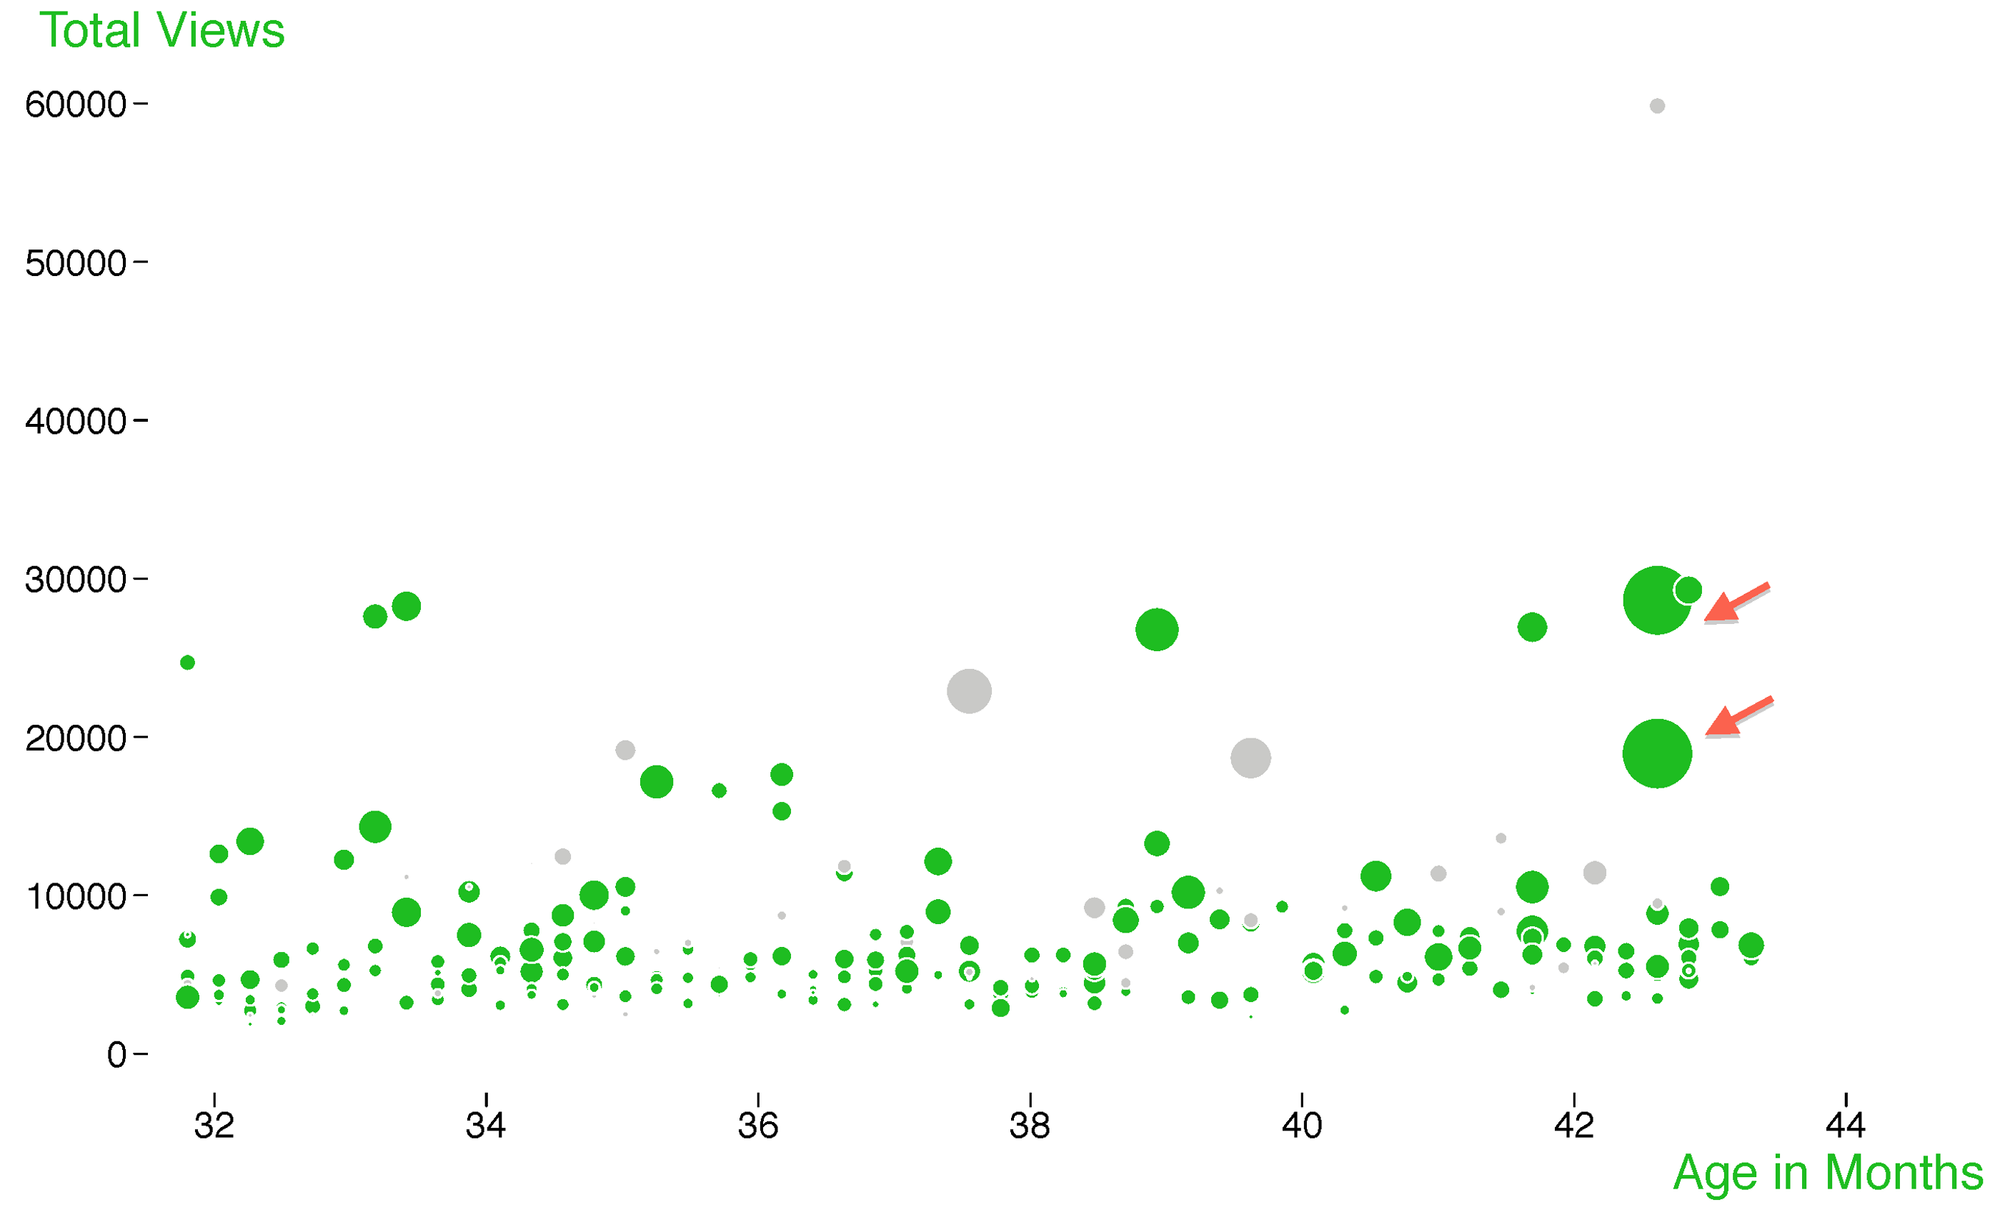
Figures are an important part of any scientific document. While the kind of figure commonly used obviously varies between disciplines, charts are an important part of many publications.

Altmetrics track the impact of scholarly works in the social web. Article-Level Metrics focuses on articles, but also looks at traditional citations and usage statistics. The PLOS Article-Level Metrics project was started in 2008. The altmetrics manifesto was published in October 2010 and described the fundamental ideas. By October 2011 we had a number of altmetrics tools, fueled by the Mendeley/PLOS API programming contest.