The rOpenSci Unconference is coming to Australia and we are excited!! The event will take place in sunny Brisbane, on April 21-22 2016 hosted at the Microsoft Innovation Centre.
rOpenSci - open tools for open science
Scientific articles are typically locked away in PDF format, a format designed primarily for printing but not so great for searching or indexing. The new pdftools package allows for extracting text and metadata from pdf files in R. From the extracted plain-text one could find articles discussing a particular drug or species name, without having to rely on publishers providing metadata, or pay-walled search engines.
We’ve got a big year ahead of us as we work towards expanding our team and organizing various events and activities. We remain committed to supporting and expanding the landscape of open source tools that are available to researchers. While much of our focus has been around making it easier to access various data repositories, we are keen on improving other parts of the research pipeline, including data munging, documentation and sharing.
rOpenSci, whose mission is to develop and maintain sustainable softwaretools that allow researchers to access, visualize, document, and publishopen data on the Web, is pleased to announce that it has been awarded agrant of nearly $2.9 million over three years from The Leona M. andHarry B. Helmsley Charitable Trust.
A new version of rentrez, our package for the NCBI’s EUtils API, is makingit’s way around the CRAN mirrors. This release represents a substantialimprovement to rentrez, including a new vignettethat documents the whole package. This posts describes some of the new things in rentrez, and gives us a chanceto thank some of the people that have contributed to this package’s development.
We’re happy to announce the launch of a CRAN-style repository for rOpenSci at http://packages.ropensci.org This repository contains the latest nightly builds from the master branch of all rOpenSci packages currently on GitHub.
Despite the hype around “big data”, a more immediate problem facing many scientific analyses is that large-scale databases must be assembled from a collection of small independent and heterogeneous fragments – the outputs of many and isolated scientific studies conducted around the globe. Collecting and compiling these fragments is challenging at both political and technical levels.

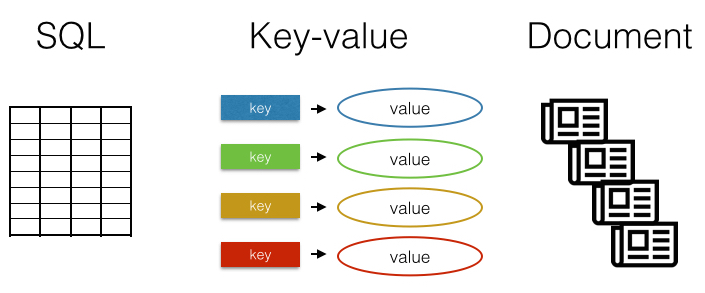
There are many different databases. The most familiar are row-column SQL databases like MySQL, SQLite, or PostgreSQL. Another type of database is the key-value store, which as a concept is very simple: you save a value specified by a key, and you can retrieve a value by its key. One more type is the document database, which instead of storing rows and columns, stores blobs of text or even binary files.
There are two things that make R such a wonderful programming environment - the vast number of packages to access, process and interpretdata, and the enthusiastic individuals and subcommunities (of which rOpenSci is a great example). One, of course, flows from the other:R programmers write R packages to provide language users with more features, which makes everyone’s jobs easier and (hopefully!)attracts more users and more contributions.
rOpenSci specializes in creating R libraries for accessing data resources on the web from R. Most times you request data from the web in R with our packages, you should have no problem. However, you evenutally will run into problems. In addition, there are advanced things you can do modifying requests to web resources that fall in the advanced stuff category.
Key to the success of rOpenSci is our community and we want to hear more regularly from our members, and foster new interactions among the group. In addition, community calls are a way for us to give important updates, and get feedback on them. We tentatively plan on doing community calls once per month. The format of rOpenSci community calls could be of various types.