Scienze naturaliInglese
Pubblicato
Autore Donny Winston
What makes data reliable? A recent article 1 outlines five properties. It’s “clean” – formatted uniformly, conforming to certain rules/schema, etc.
What makes data reliable? A recent article 1 outlines five properties. It’s “clean” – formatted uniformly, conforming to certain rules/schema, etc.
Organizational capabilities can be divided into three categories: resources, processes, and priorities. Resources are what you use to achieve an outcome, processes are how you achieve it, and priorities are why . Understanding capabilities in this way can aid in strategy not only across a large organization but also within units, and even for individuals. 1 Resources are tangible assets.
How do you source data relevant for some analysis? Once you “have” the data, how do you feed it to the analytic task? Traditional enterprise data integration joins paths across a handful of silos for a handful of specific analytic tasks. In data science, however, neither the set of relevant silos nor the set of relevant analytic tasks are both small and well-defined.
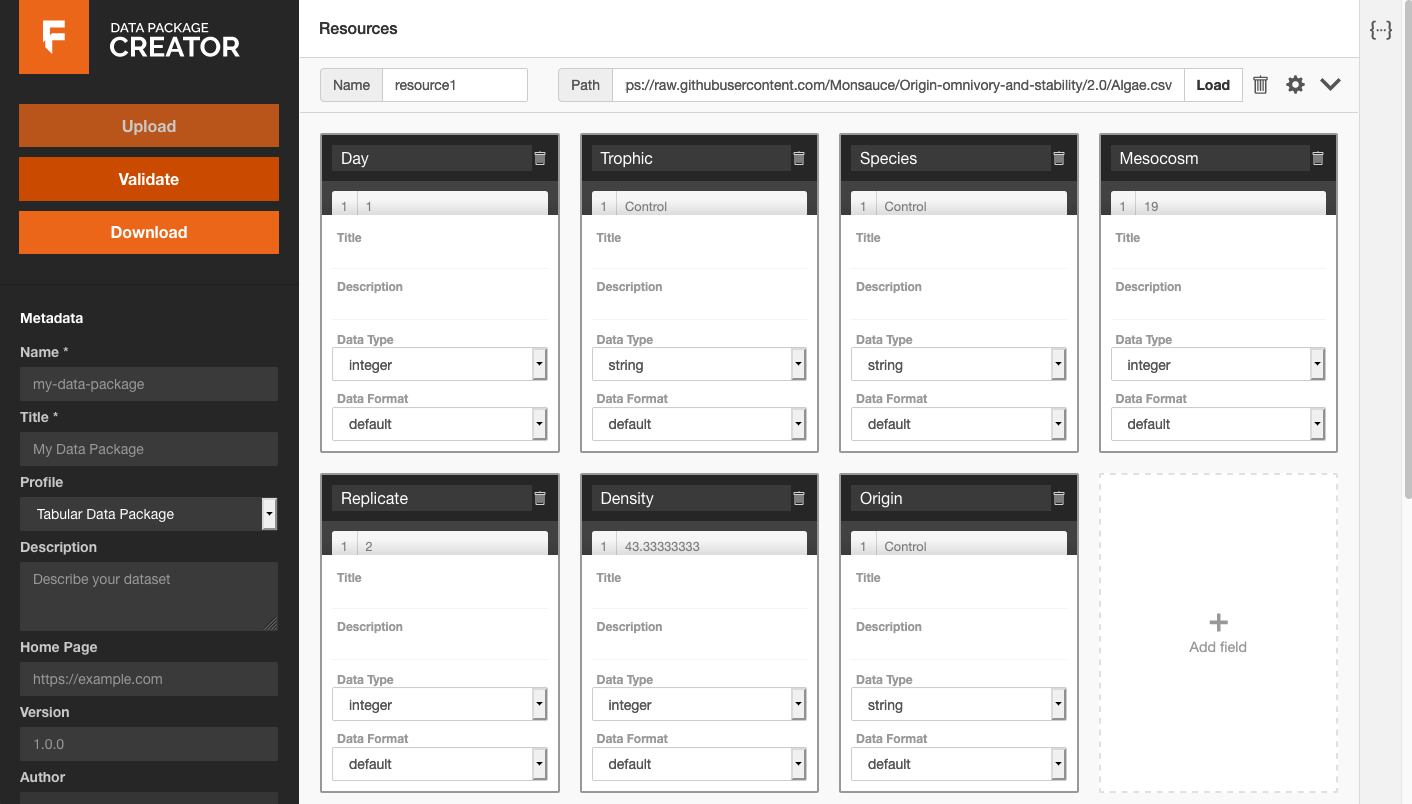
I was reminded of the importance of approachable, low-barrier-to-entry tools for data management by Monica Granados and Lily Zhao in their presentation of the Frictionless Data toolkit. 1 They showcased use of a browser-based interface 2 for a simple yet valuable task: associating title and description metadata with potentially cryptic column header names in a CSV file, and exporting that metadata together with the raw data
Laws are rules that a particular community recognizes as regulating the actions of its members. From this definition, Serena Peruzzo detailed how she sought to use tools from Natural Language Processing (NLP) to “find a representation of the rules that makes them more accessible and understandable.” 1 One proposed use case is to identify and highlight ambiguities.
In an episode of the CoRecursive podcast 1 , Sam Ritchie uses the phrase “portal abstraction” to describe how the use of a particular term can open a portal – a gateway – to a world of relevant prior art. He discusses issues in analytics. One issue is distributing summative calculations over data both as batches and in real-time, specialized for “big” and “fast” data, respectively.
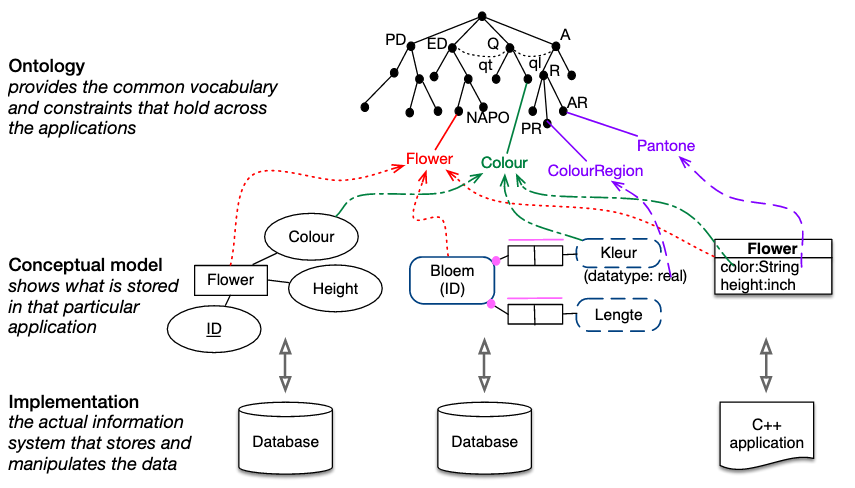
As part of her introduction to ontology enginering, 1 Prof. Maria Keet has a slide depicting ontology as a layer apart from conceptual data models: Conceptual data models vs. ontologies. [source] I like this visualization of various project-specific conceptual models and their associated implementations in databases and codebases.
There’s a Python library called monty that supports a convention for moving between JSON objects and Python class instances. The major components are a mix-in class, MSONable, along with subclasses of json.encoder.JSONEncoder and json.decoder.JSONDecoder. An appropriate JSON object will have two special keys: @module and @class.
I’ve heard the phrase “just the tip of the iceberg” used as a positive phrase when revealing value of which an audience might not have been previously aware. In the context of disseminating scientific data, this tip might be a publication. A reader sees paragraphs and figures that describe and show data. A Supplemental Information section might link to a much greater volume of data – the rest of the iceberg.
An effective data unification system is like having an ATM network for your data. Instead of having to get to a branch (and only during open hours), wait in line, and talk to a teller, even for simple withdrawals and balance inquiries, with an ATM you can do many common operations on-demand and quickly.
I was fascinated as I skimmed over a publication detailing a network analysis of crystalline materials. 1 It’s “Open Access”, meaning I don’t have to pay to read the text and figures. There was one figure that had neat data-driven graphics for two separate materials, one stacked on top of the other. I wondered what the graphics would look like for some of the other 22,600 materials considered by the study.