Data ThoughtsRStatistical ModellingPowerInglês
Publicados
Autor Nicola Romanò

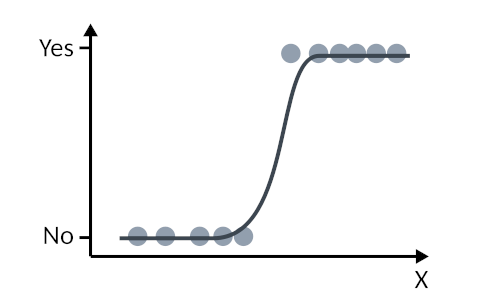
In this post we will introduce the concept of statistical power and we are going to use R to perform a power analysis through simulation. I know what power analysis is! Just show me the code! Table of Contents Introduction – what is power? In science, we often want to assess the effect of a certain factor or set of factors on an outcome.