Ciências da saúdeInglêsQuarto

Oxford iHealth

Fostering innovation, research, and education in the field of computational sciences for health
Pagina inicialFeed RSS
language
StoriesAnnouncementCommunityChampions ProgrammeCiências da saúdeInglês
Publicados
Autor Proochista Ariana

After the pilot run of the Open and Reproducible Science in R module for IHTM Class 2021-2022, it was apparent based on student feedback that learning to code in R was something most of our students valued. As with other elements of the course, it is clear that more impactful learning happens when students use whatever they have learned on an actual analytic task.

NewsCiências da saúdeInglês
Publicados
Autor Ernest Guevarra

October is here again and it is time to welcome our new cohort - Class 2025 - of the MSc in International Health and Tropical Medicine. We met all 19 students of the current cohort last week on the 1st and 2nd of October as they went through the now customary laptop setup for the Open and Reproducible Science in R module.

NewsAnnouncementCiências da saúdeInglês
Publicados
Autor Ernest Guevarra

It’s been a few years in the making. With ongoing collaborations with IHTM alumni on projects in Liberia and Seychelles and having initiated the Open and Reproducible Science in R module 4 years ago, we’ve finally been able to formalise our vision of global health partnerships and collaboration.

TutorialVisualisationCiências da saúdeInglês
Publicados
Autor iHealth Team

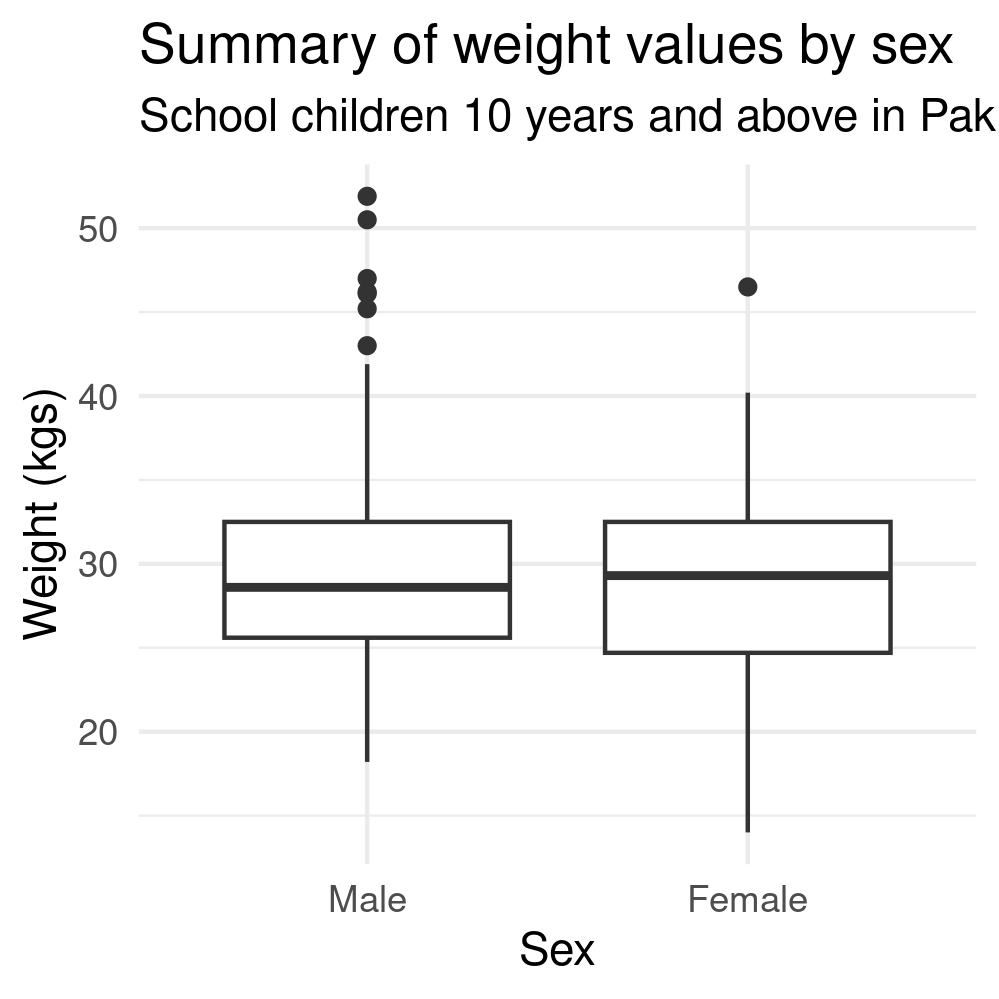
Boxplots (also called box-and-whisker plots) are a graphical tool used to summarise and display the distribution of a continuous variable. They are useful for several reasons: Identifying Outliers : Boxplots clearly highlight outliers (values that fall significantly outside the range of most of the data). Outliers are shown as individual points beyond the “whiskers” of the plot.