Ciencias PolíticasInglésQuarto

Andrew Heiss's blog

Andrew Heiss's blog
Página de inicioFeed RSSMastodon
language
PositronAutomatorCiencias PolíticasInglés
Publicado

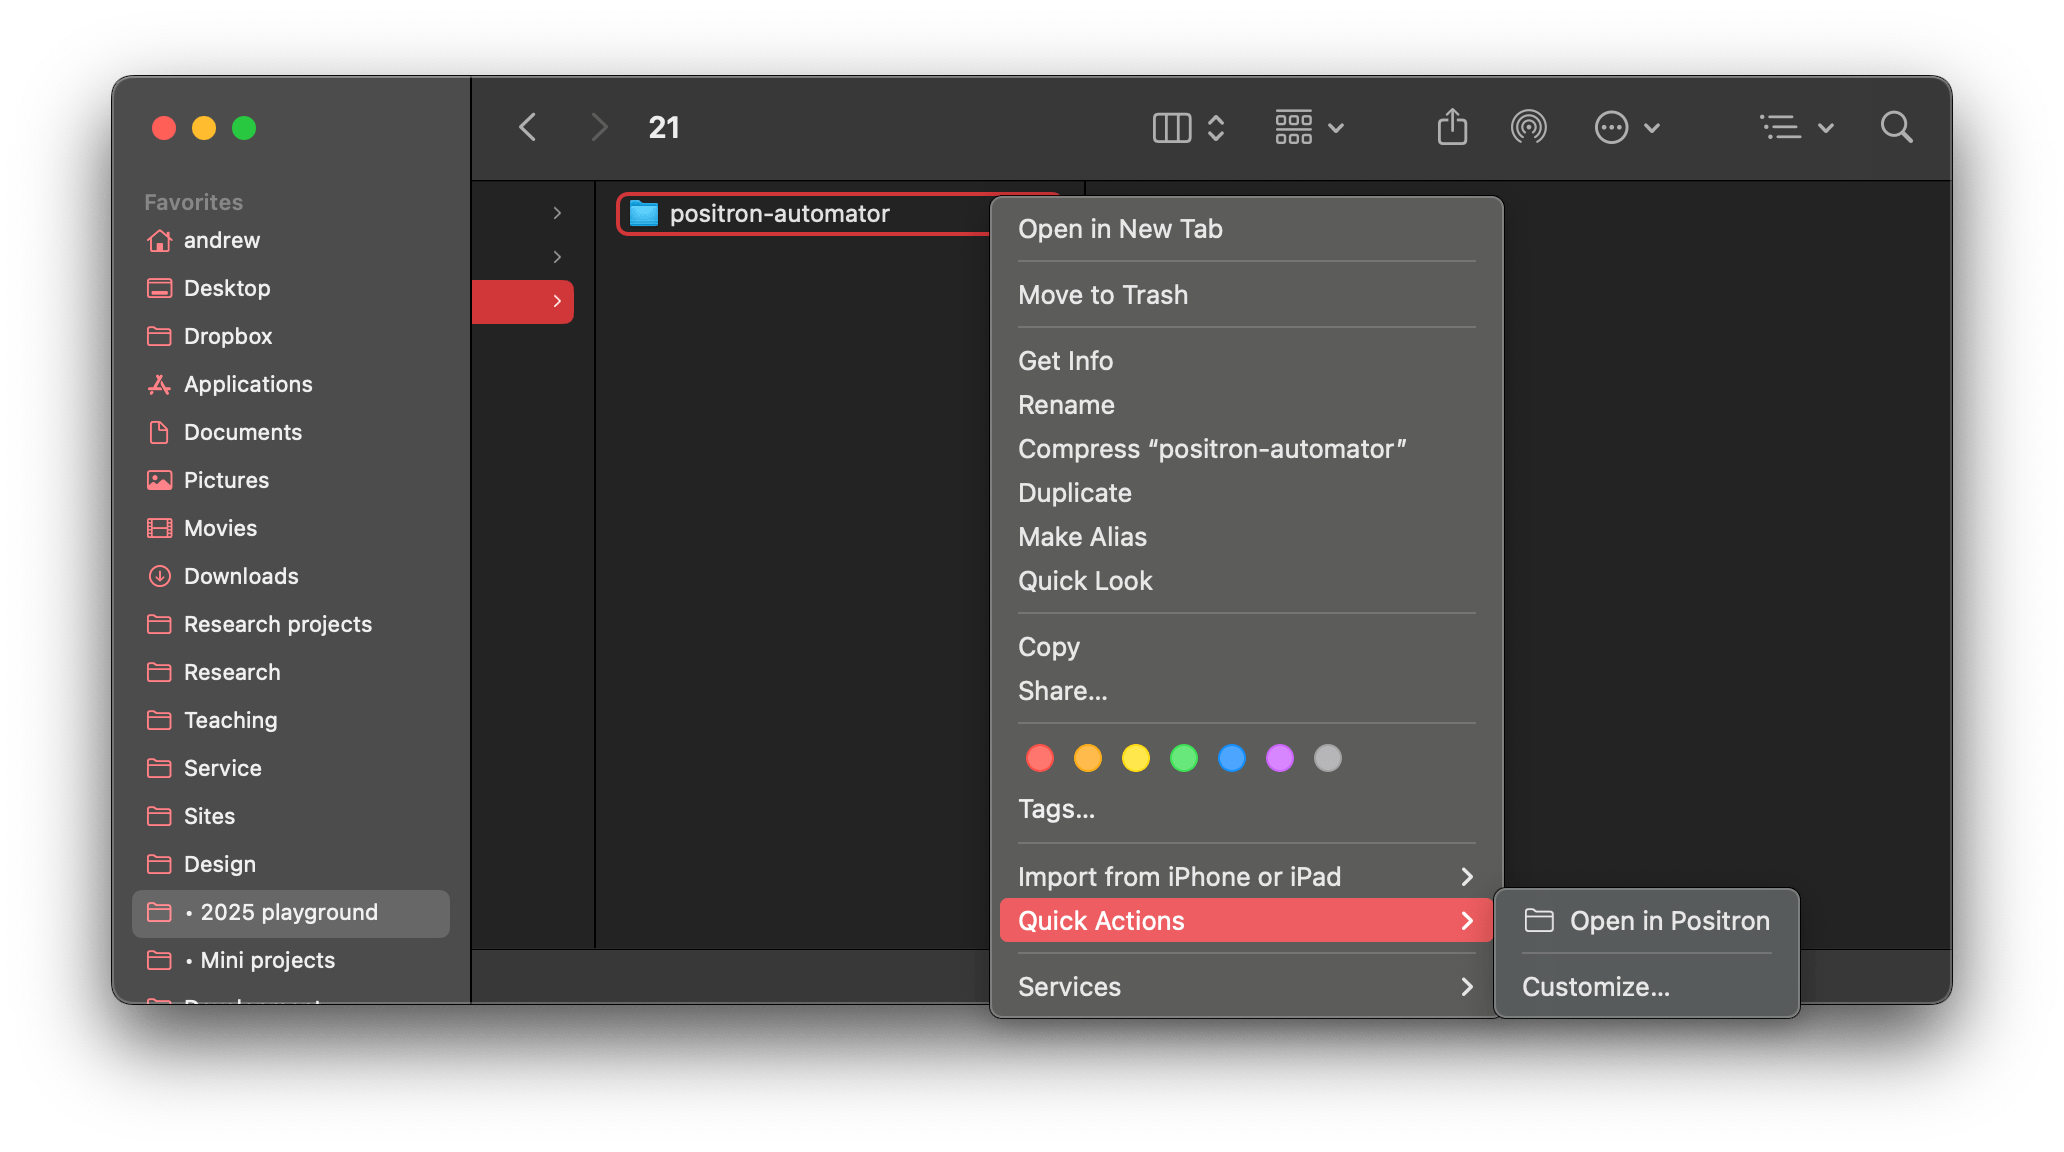
tl;dr Download and unzip this: “Open in Positron” Quick Action Put Open in Positron.workflow in ~/Library/Services. Now you can right click on folders in Finder, go to Quick Actions, and select “Open in Positron” to open folders as projects in Positron. One thing I’m still adjusting to in Positron is how it treats projects and folders.

PositronDockerCiencias PolíticasInglés
Publicado

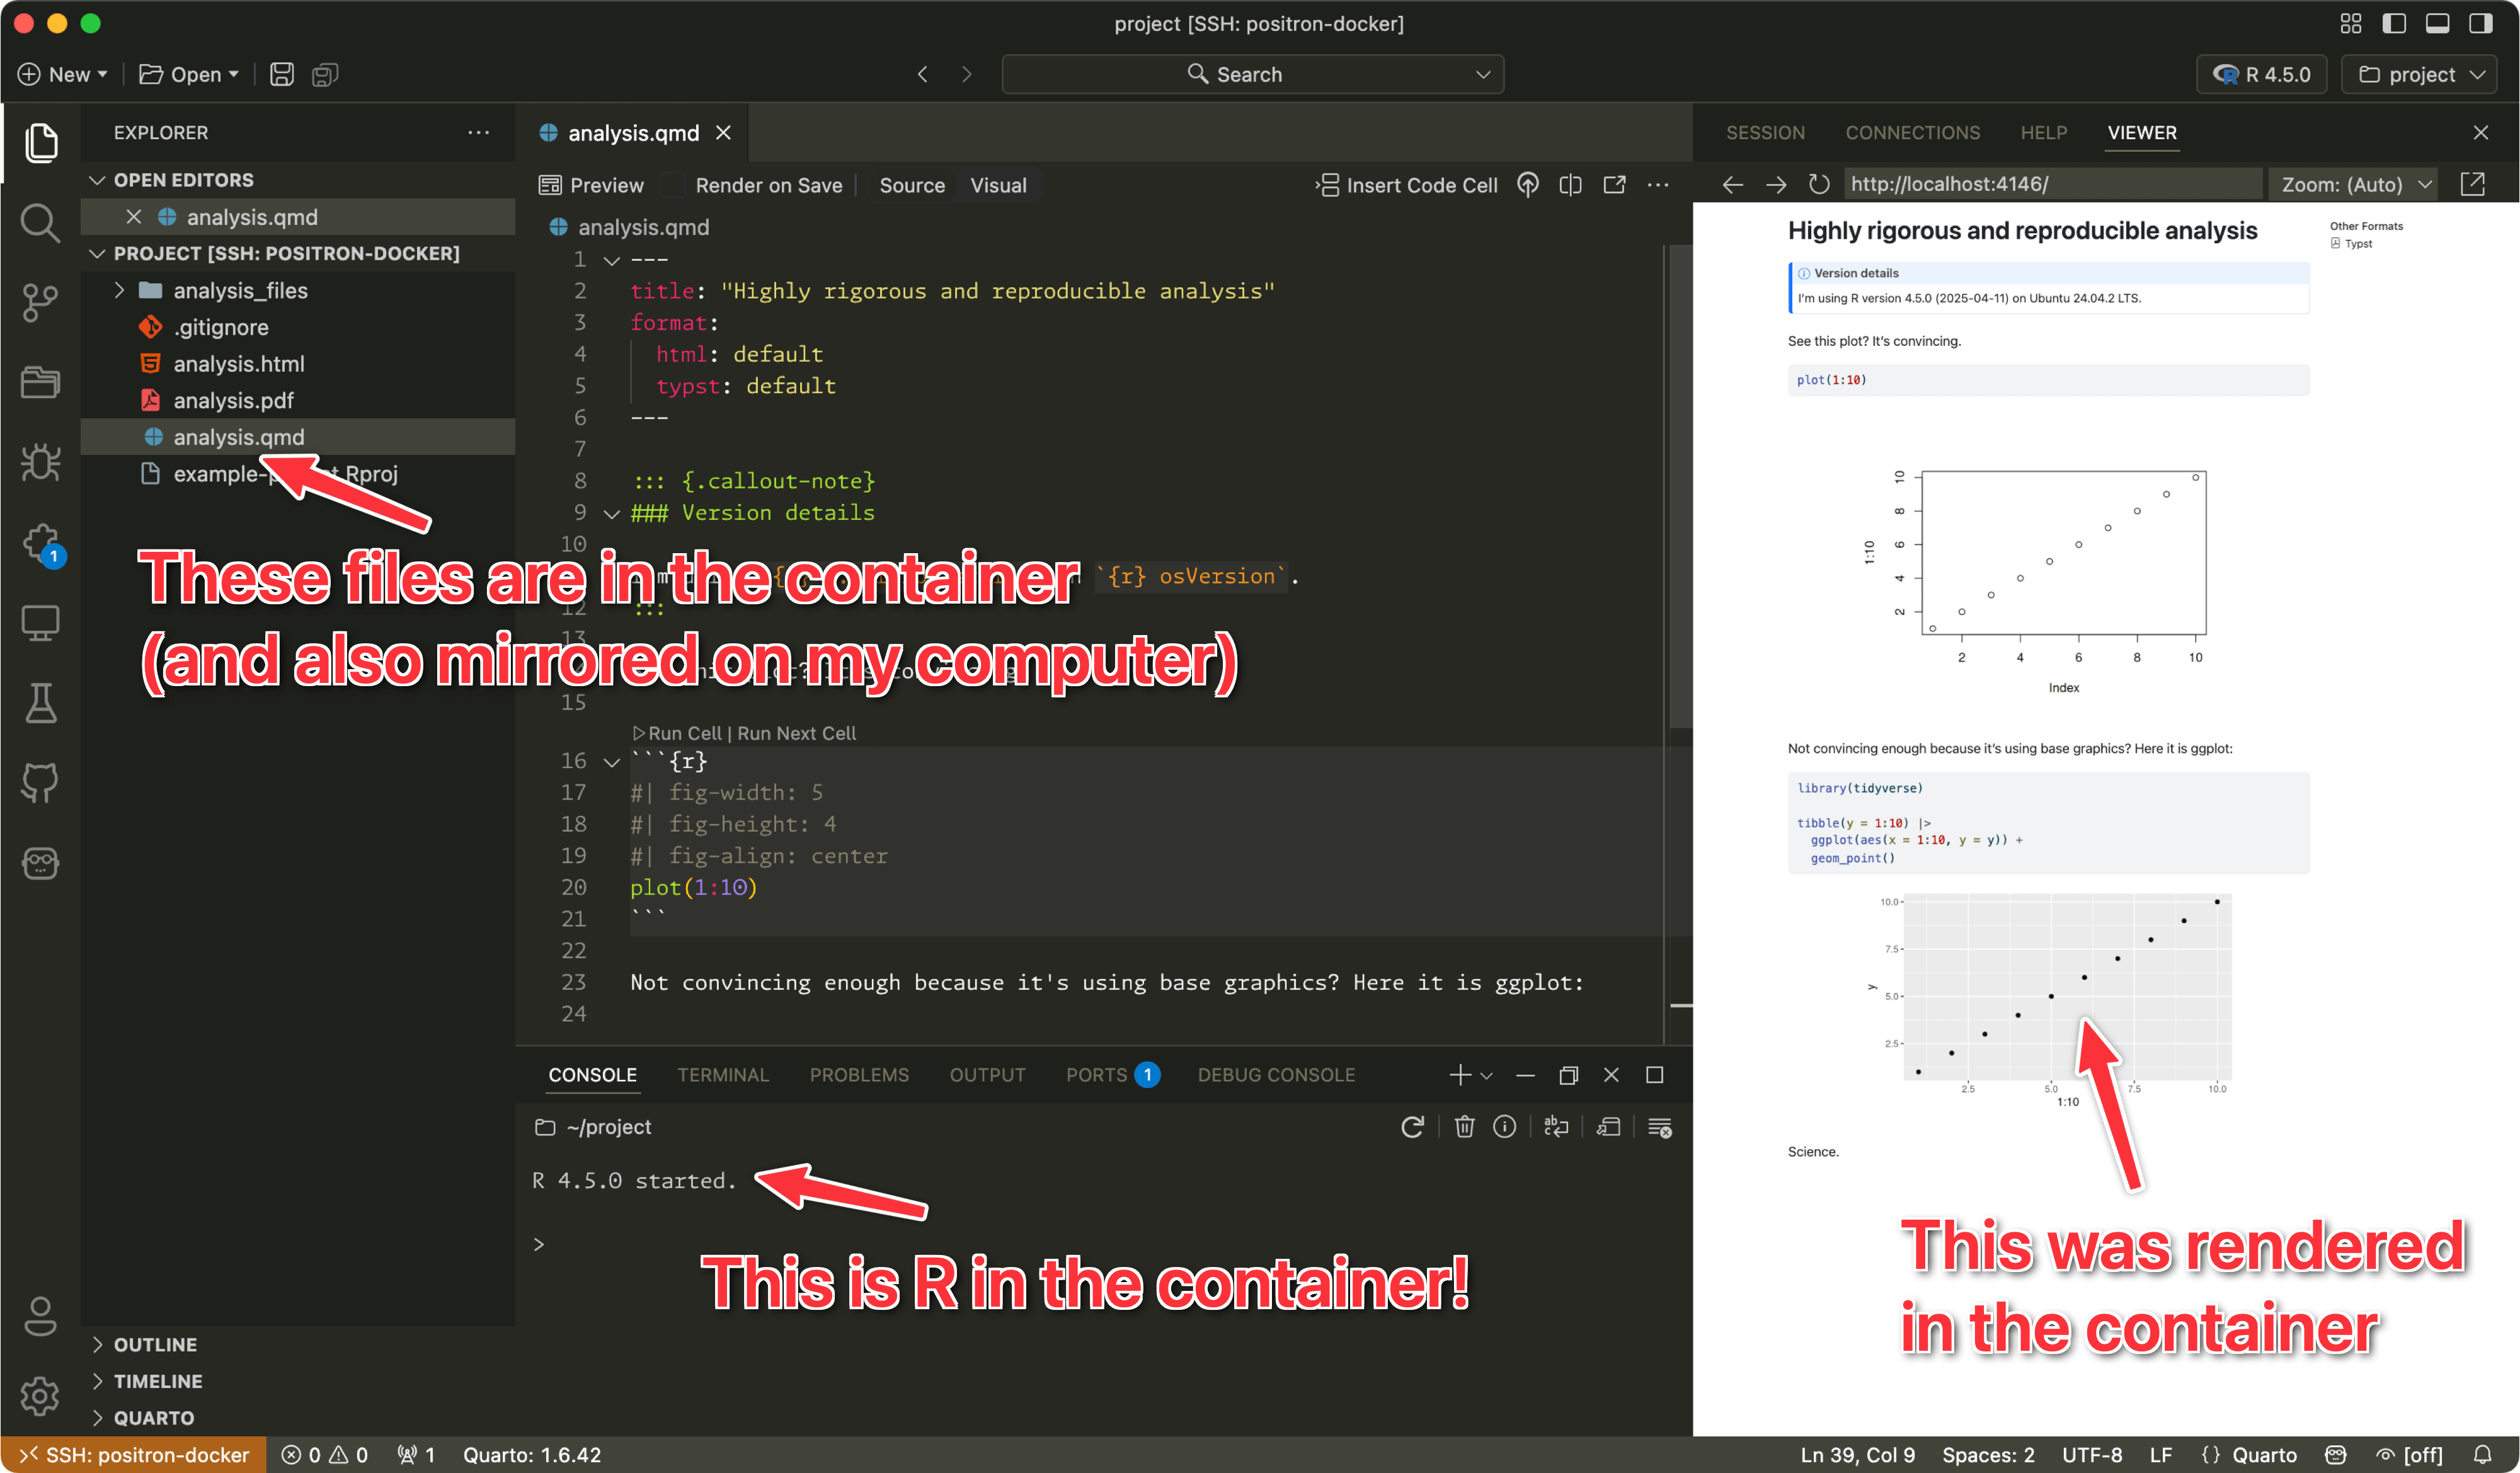
I’ve long been a proponent of making quantitative research reproducible. It’s the main reason I do all my scientific writing in Quarto—I can mix code and text in the same document so I don’t need to copy/paste numbers, tables, and figures from some statistical program into a word processor. Everything automatically ends up one compiled document based on the most current data.

PositronWritingData ScienceCiencias PolíticasInglés
Publicado

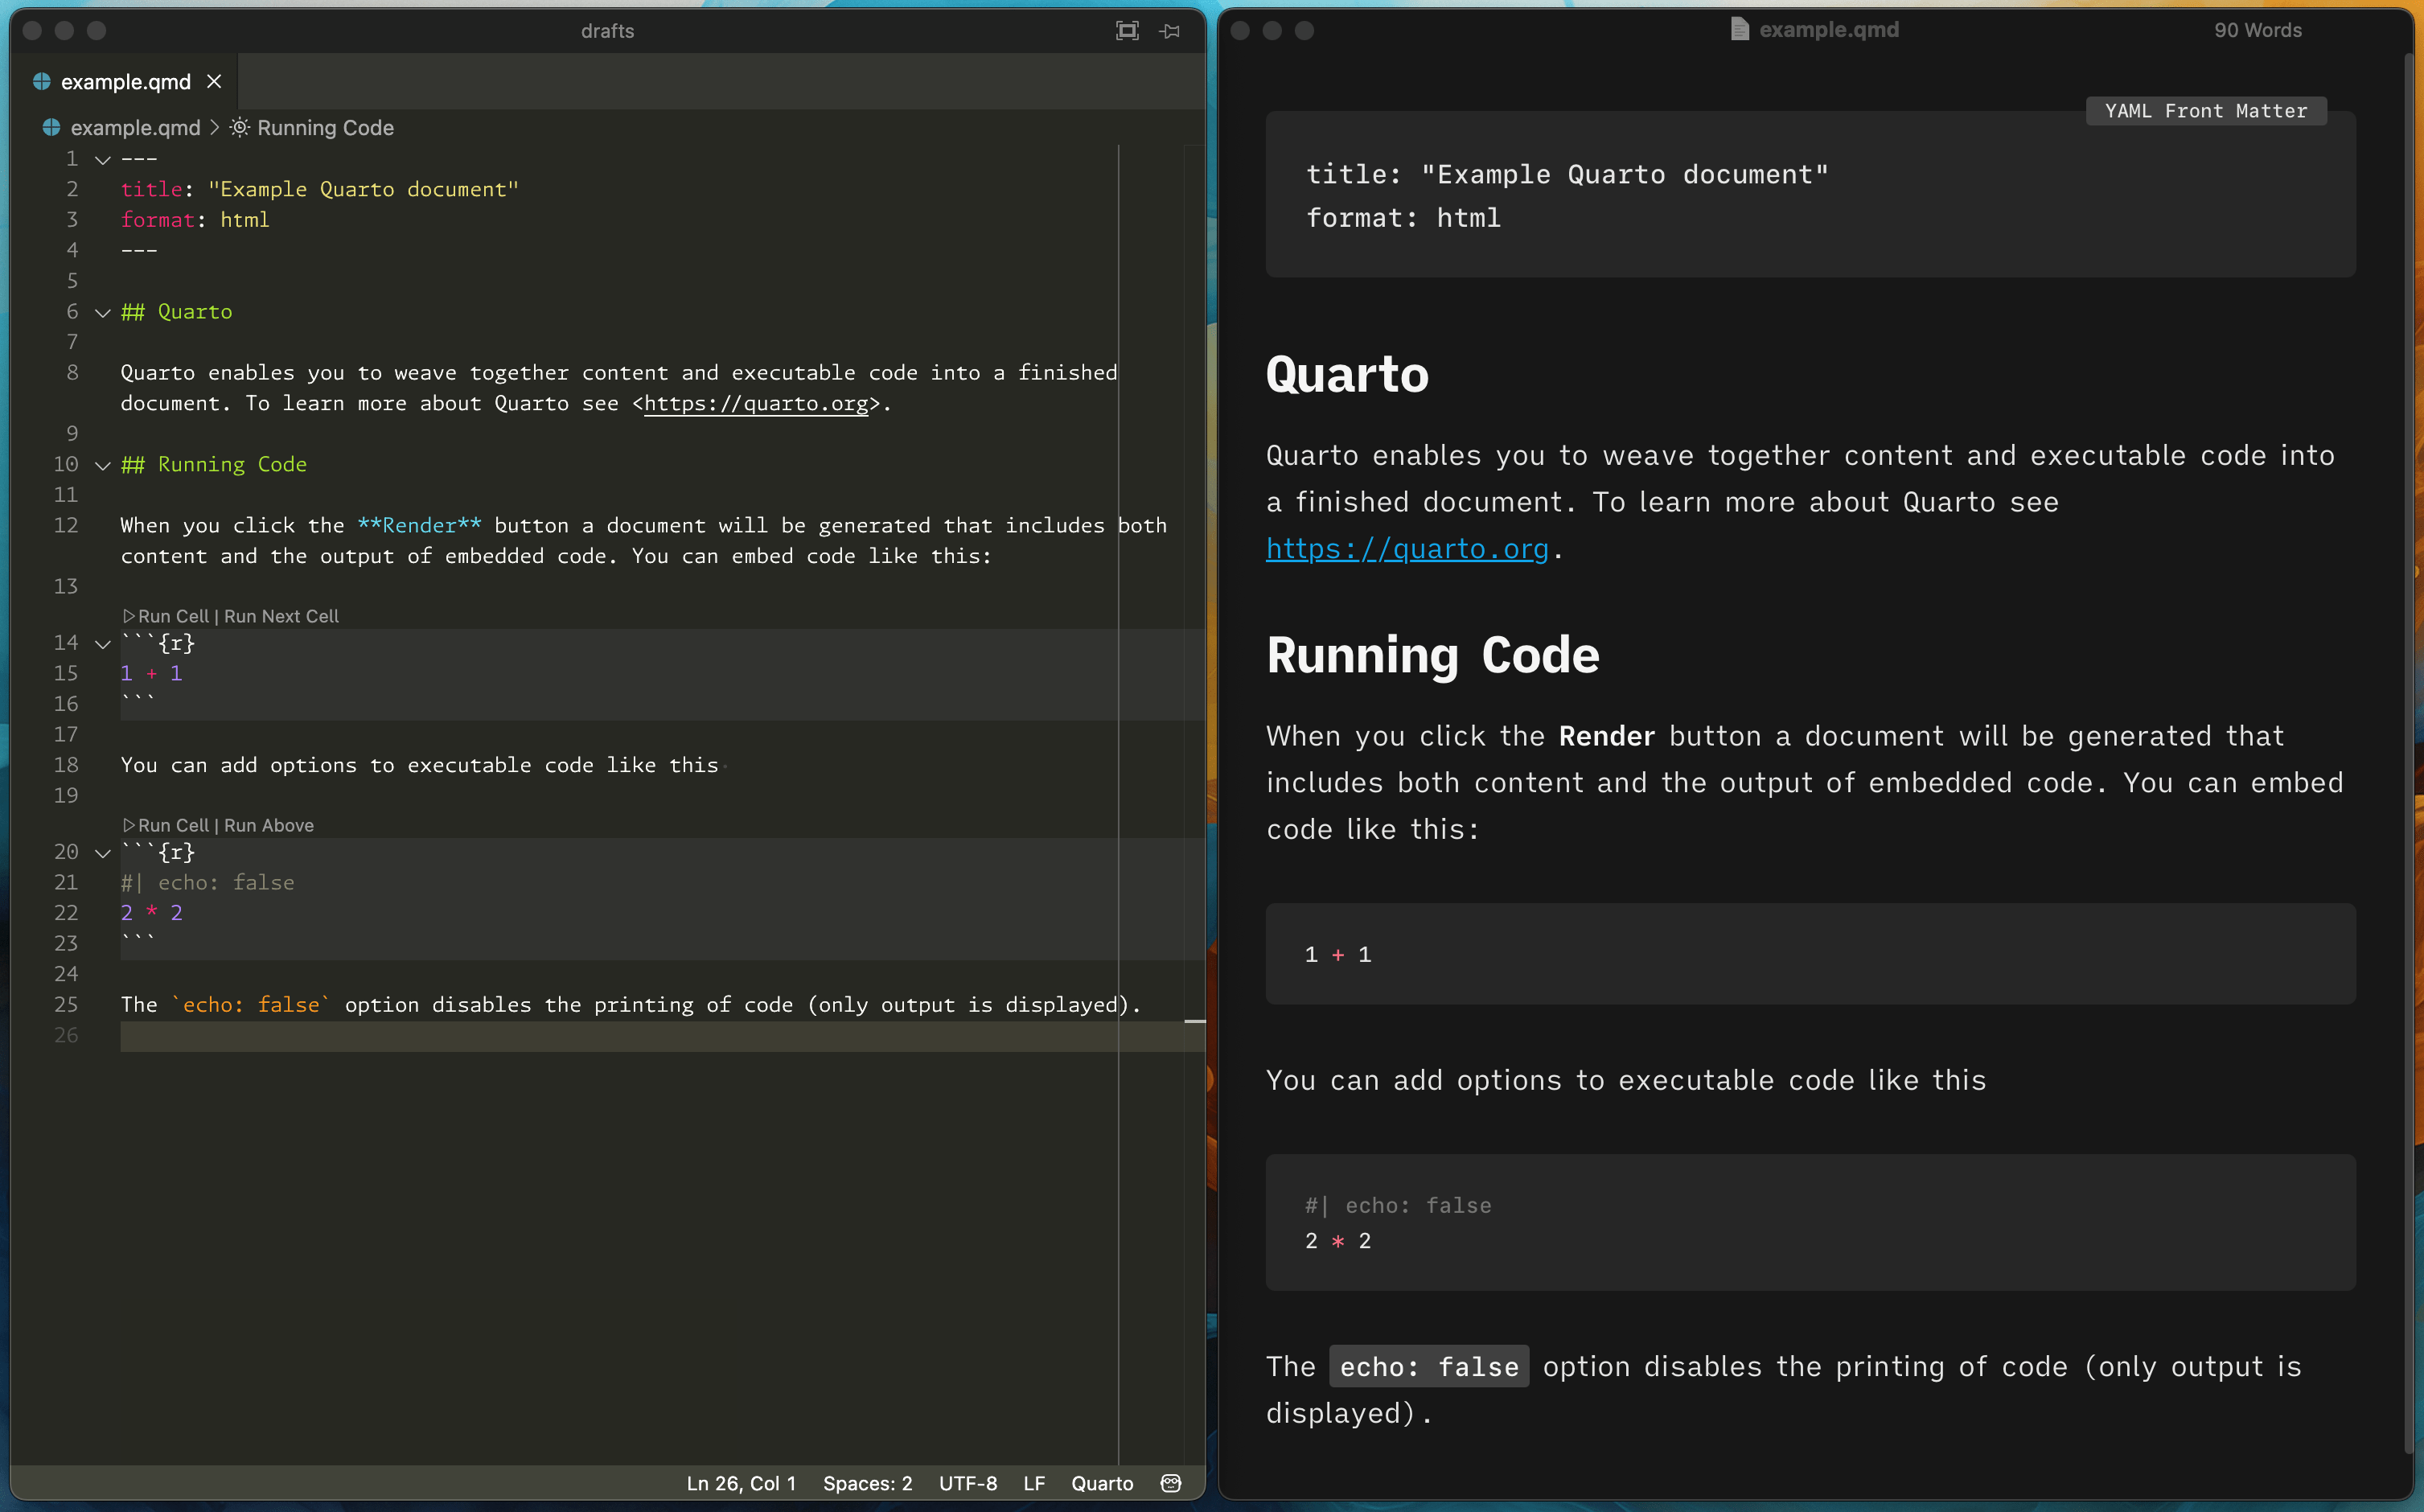
Positron’s Quarto support is really quite robust and it’s full of nice little features like previewing a citation using whatever bibliography style your document is using (Chicago, APA, etc.) when you hover over a citation key: …or knowing about the different headings inside your document for tab-completed cross references: …or even knowing about those headings in other documents in a project: That’s all neat, but for long-form writing, like

RTidyverseGgplotGisMapsCiencias PolíticasInglés
Publicado

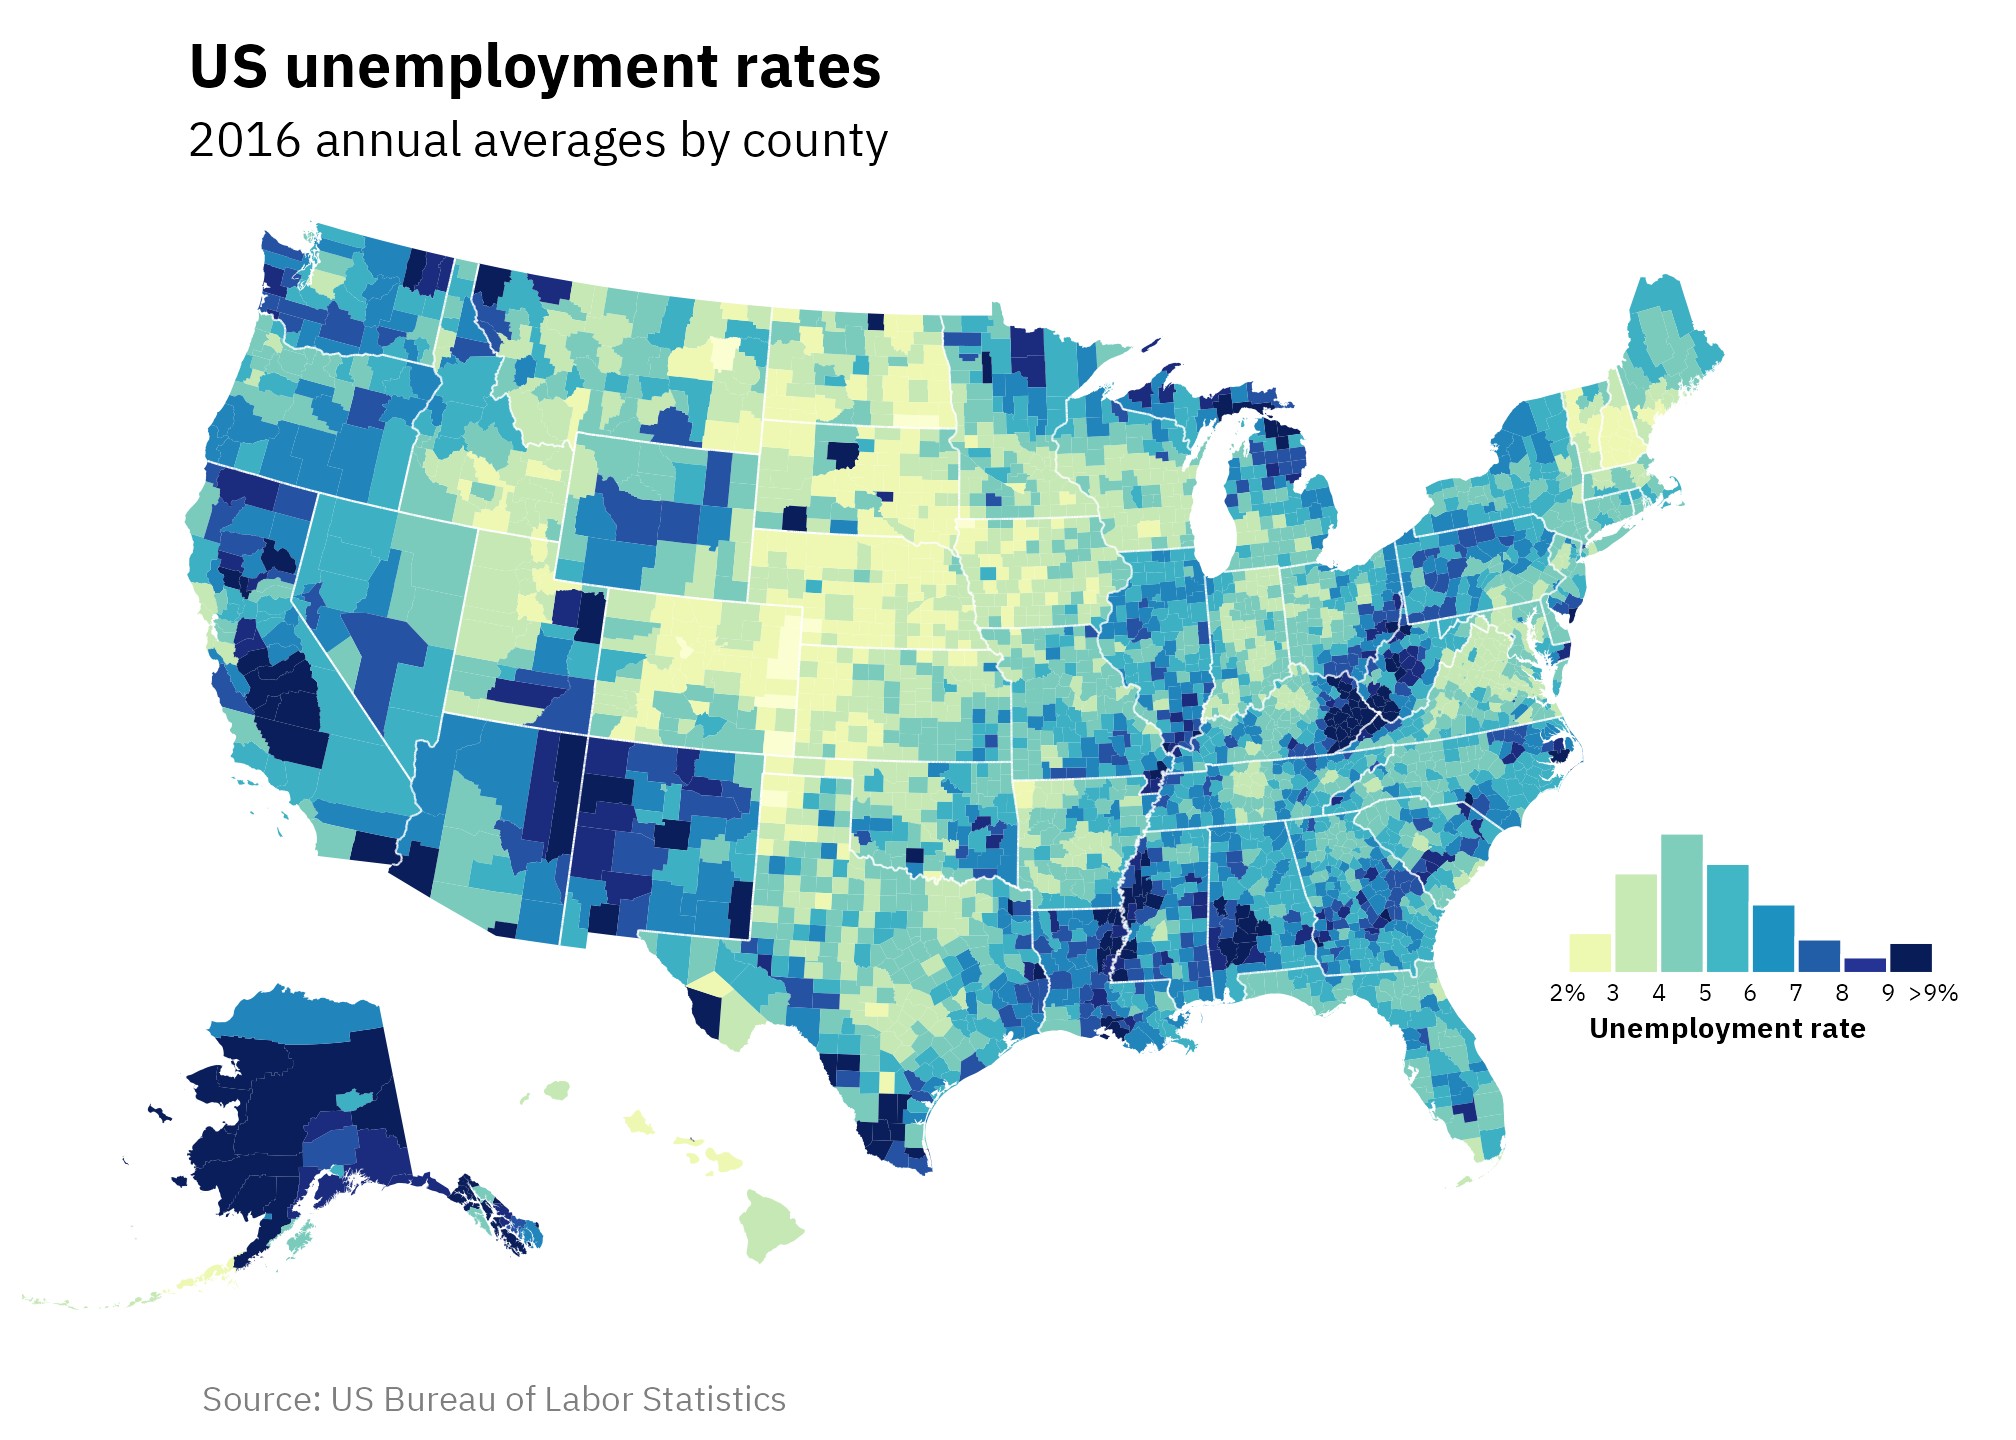
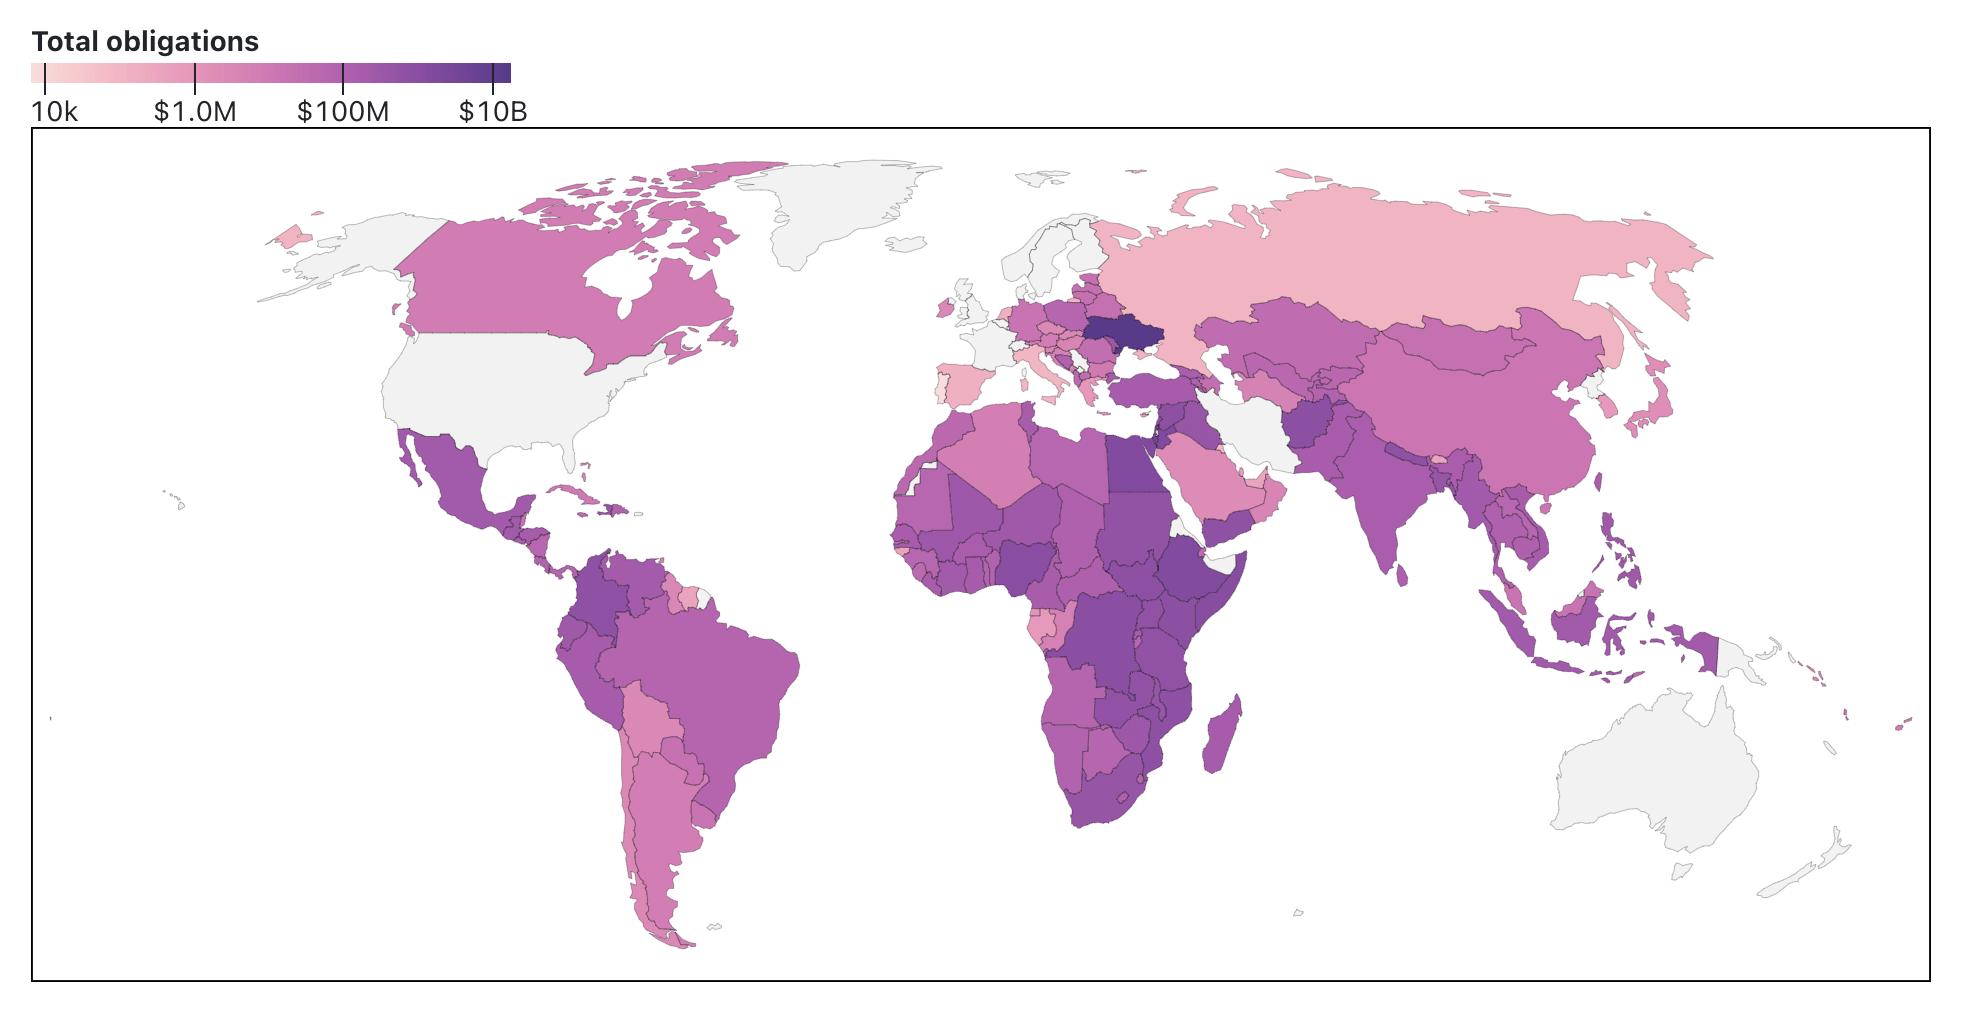
On Bluesky the other day, I came across this neat post that suggested using a histogram as a plot legend to provide additional context for the data being shown: Here’s a closer comparison of those two maps (click to zoom): This histogram legend is especially useful for choropleth maps where units like counties are sized differently, which can create an illusion of a different distribution.

RTidyverseGgplotOjsObservable PlotCiencias PolíticasInglés
Publicado

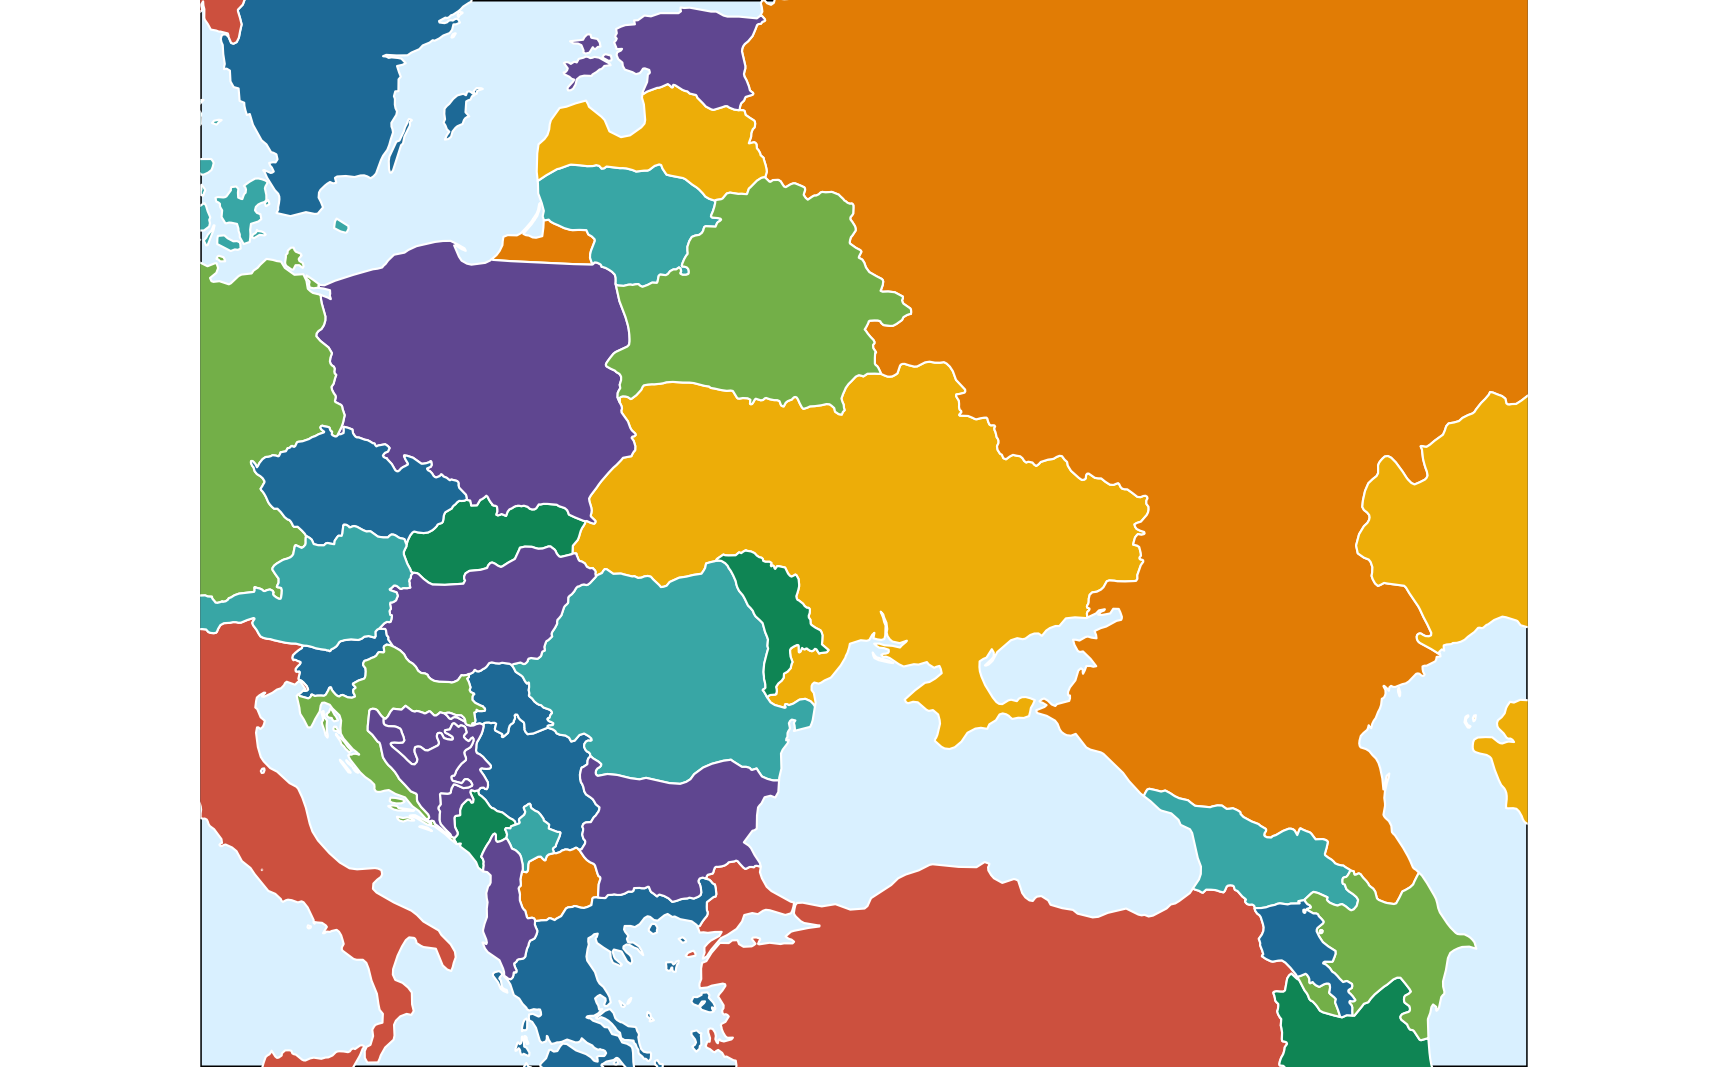
The Natural Earth Project The Natural Earth Project provides high quality public domain geographic data with all sorts of incredible detail, at three resolutions: high (1:10m), medium (1:50m), and low (1:110m). I use their data all the time in my own work and research, and the {rnaturalearth} package makes it really easy to get their data into R for immediate mapping. I mean, look at this!

RTidyverseUs CensusGgplotBayesCiencias PolíticasInglés
Publicado

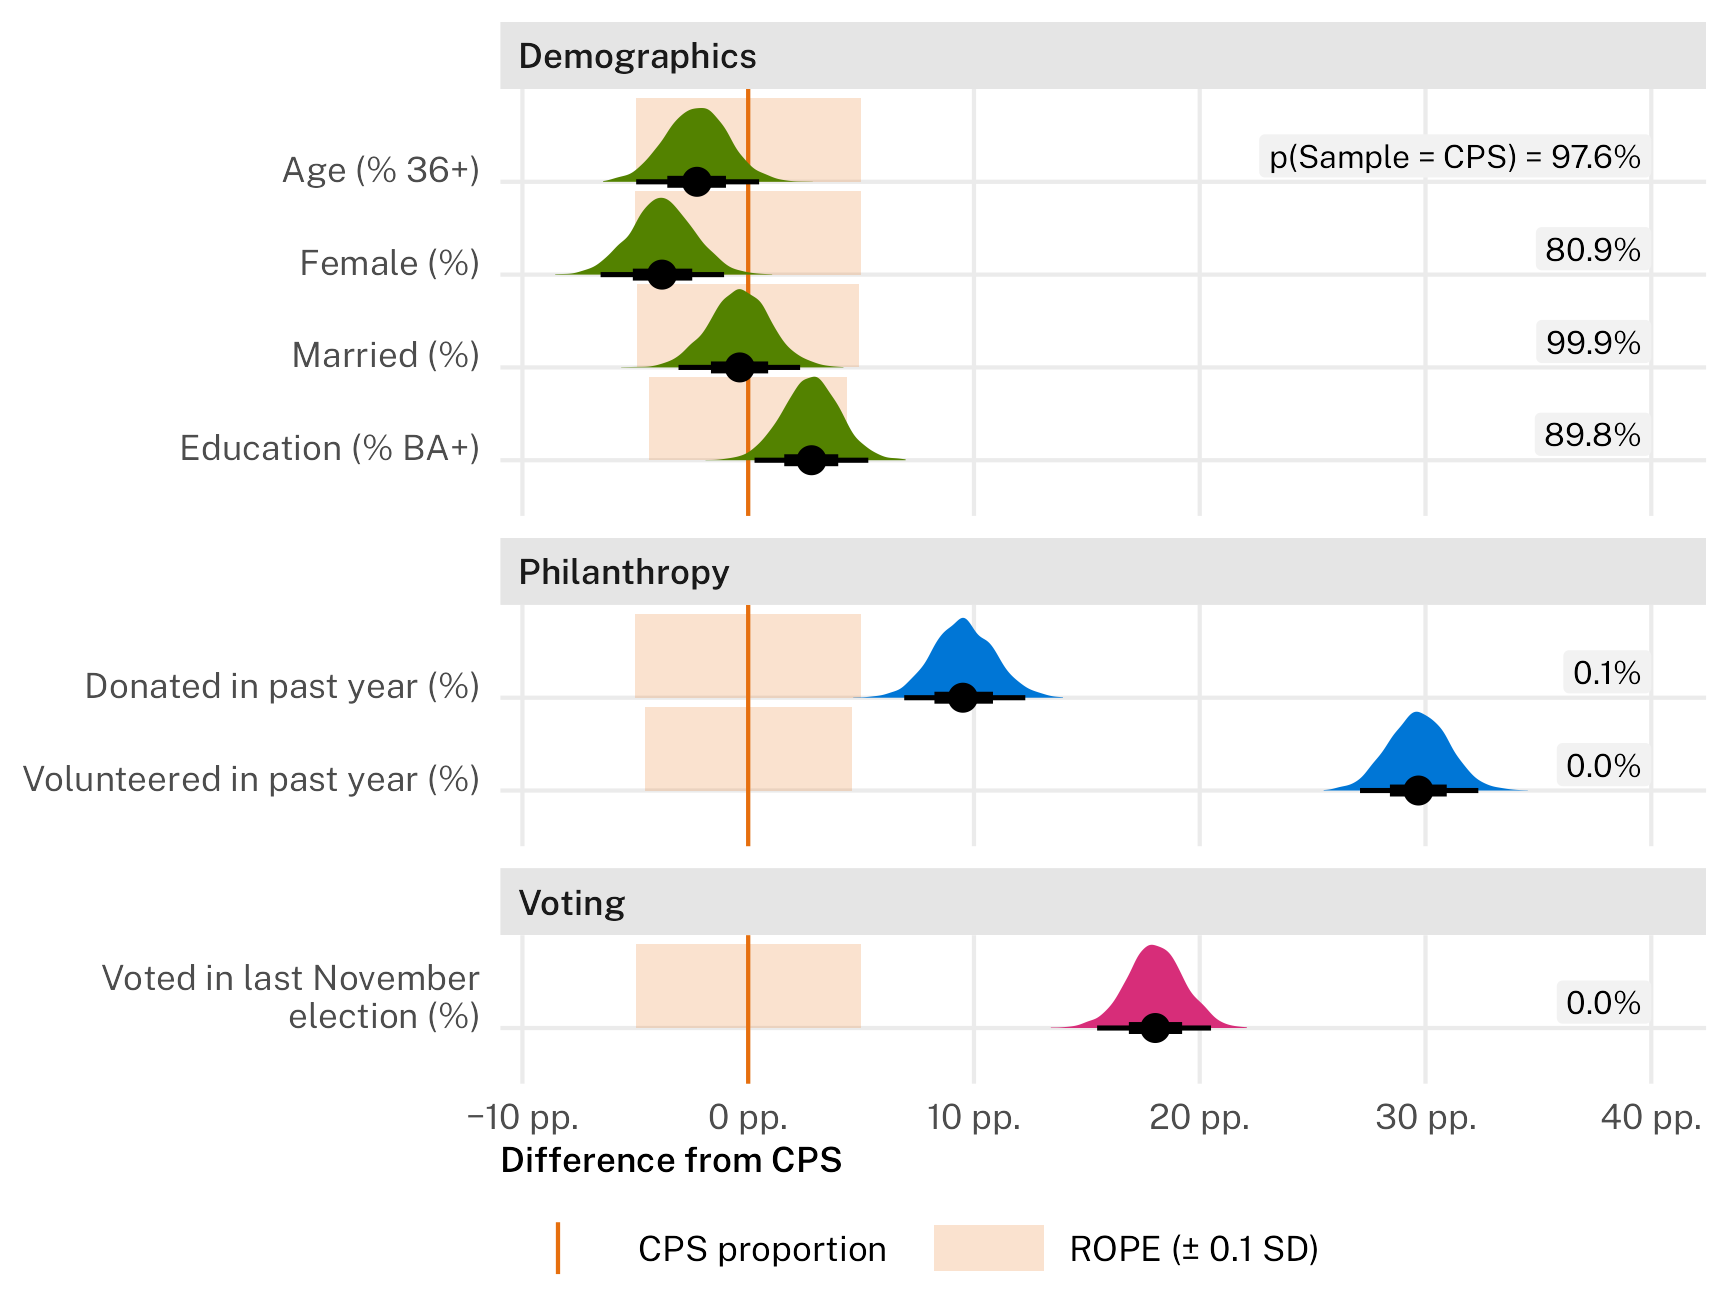
Last week I was making some final revisions to a paper where we used a neat conjoint experiment to test the effect of a bunch of different treatments on nonprofit donor preference. One of the peer reviewers asked us to compare the characteristics of our experimental sample with the general population so that we could speak a little to the experiment’s generalizability.

RQuartoMarkdownCiencias PolíticasInglés
Publicado

This year, I’ve helped build the Idaho Secretary of State’s office’s election results website for both the primary and general elections. Working with election data is a complex process, with each precinct reporting results to their parent counties, which all use different systems and software and candidate identifiers.

RPythonPositronData ScienceCiencias PolíticasInglés
Publicado

At the end of June 2024, Posit released a beta version of its next-generation IDE for data science: Positron. This follows Posit’s general vision for language-agnostic data analysis software: RStudio PBC renamed itself to Posit PBC in 2022 to help move away from a pure R focus, and Quarto is pan-lingual successor to R Markdown.