BiologíaInglésWordPress

quantixed

quantixed
x == (s || z). You say it kwontized
Página de inicioFeed AtomMastodon
language
ComputingFunGarminGpxIgorProInformática y Ciencias de la InformaciónInglés
Publicado

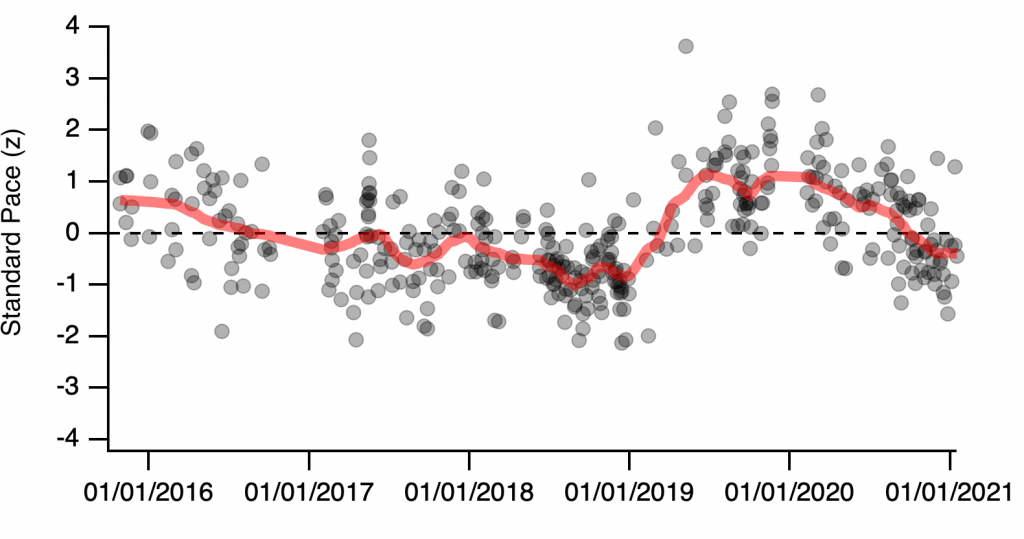
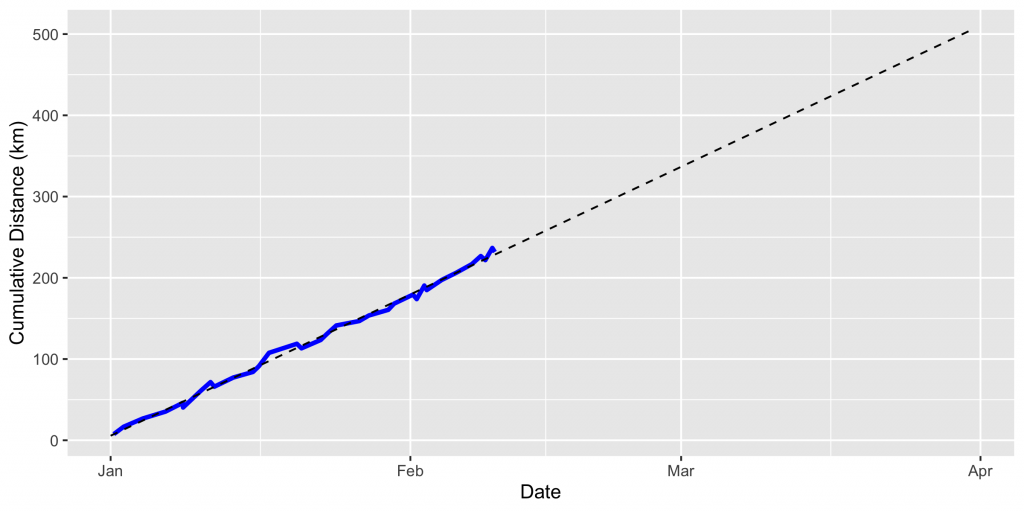
One of several features that Strava put behind a paywall was the ability to compare performance on similar courses. I miss this comparison tool and wondered how hard it would be to code my own. This post is a walkthrough of how I approached the problem. The code is available here. It uses the trackeR library in R to convert the GPX tracks to a huge dataframe. This is then processed by IgorPro.

ComputingLaTeXTftbInformática y Ciencias de la InformaciónInglés
Publicado

I searched several times in vain to solve this problem. After finding a solution, I thought i’d put it up here. The problem Formatting of units using siunitx in LaTeX does not match the typeface of the body text. We like to use the helvet package to get a close approximation to Helvetica in LaTeX.

FunColour PalettesDatavizFIJIImageJInformática y Ciencias de la InformaciónInglés
Publicado

Here is a fun post about using colour palettes in R. It starts with a computer game… After a few years of sporadically playing Super Mario World 2 – Yoshi’s Island on the Retropie, I made it to the final level.

Adventures In CodeScienceGgplotPubMedRstatsInformática y Ciencias de la InformaciónInglés
Publicado

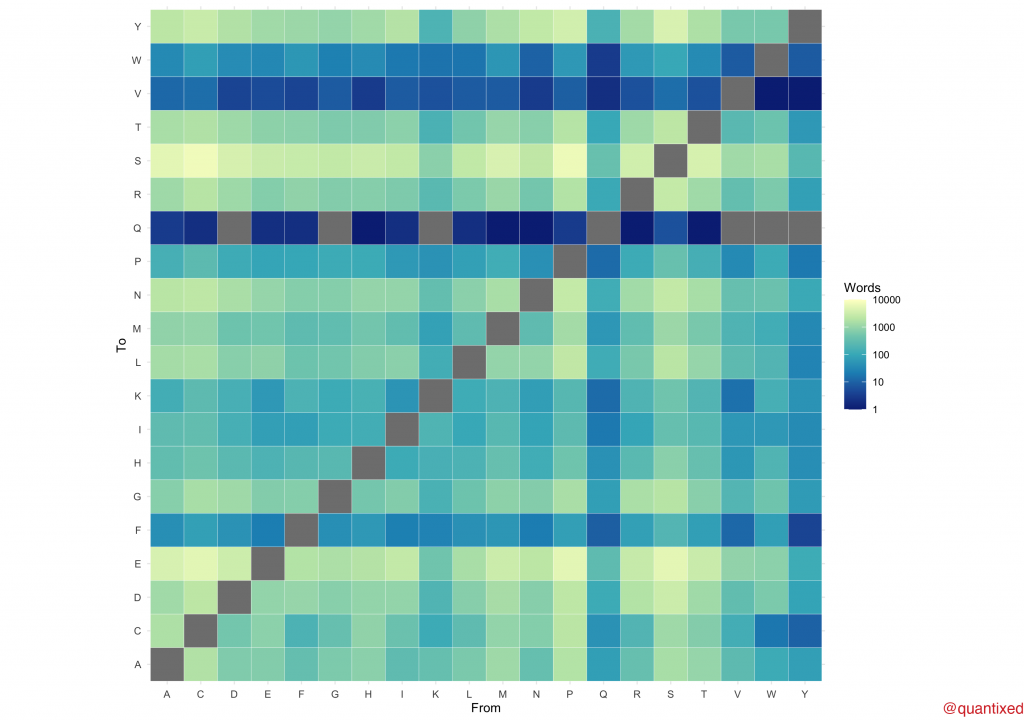
During the pandemic, many virtual seminar programmes have popped up. One series, “Motors in Quarantine”, has been very successful. It’s organised by my colleagues Anne Straube, Alex Zwetsloot and Huong Vu. Anne wanted to know if attendees of the seminar series were a fair representation of the field. We know the geographical location of the seminar attendees, but the challenge was to find a way to examine research activity at a country level.

OpinionScienceMusicOutreachInformática y Ciencias de la InformaciónInglés
Publicado

The coronavirus crisis has meant that scientific meetings and seminars have moved online. This change has led to me wondering: why don’t scientists give talks the way that musicians do gigs? The idea is: after posting a preprint or publishing a paper, a scientist advertises that they will livestream a seminar to explain the work. Attendance is free.

FunGarminGPSGpxPlotsInformática y Ciencias de la InformaciónInglés
Publicado

Joe Friel reposted an article earlier this year on Efficiency Factor in running. Efficiency Factor (EF) can be viewed in Training Peaks software and he describes how it is calculated. This post describes how I went about calculating EF in R using a single gpx file. What is Efficiency Factor (EF)? Essentially, EF is the average distance that you are propelled forward per heart beat. The higher the number, the more efficient you are at running.

Adventures In CodeFunMusicColour PalettesDatavizInformática y Ciencias de la Información
Publicado

I’m a long-term fan of Weezer. Such was the brilliance of their first two albums that I have stuck with them through thick and thin. And dear me, there has been some very thin music. Nonetheless I own every album – thirteen of them. Among them are six albums entitled “Weezer”. These records are colloquially referred to by the colour of the album. In chronological order: blue, green, red, white, teal and black.

PublishingLag TimesPubMedRstatsInformática y Ciencias de la InformaciónInglés
Publicado

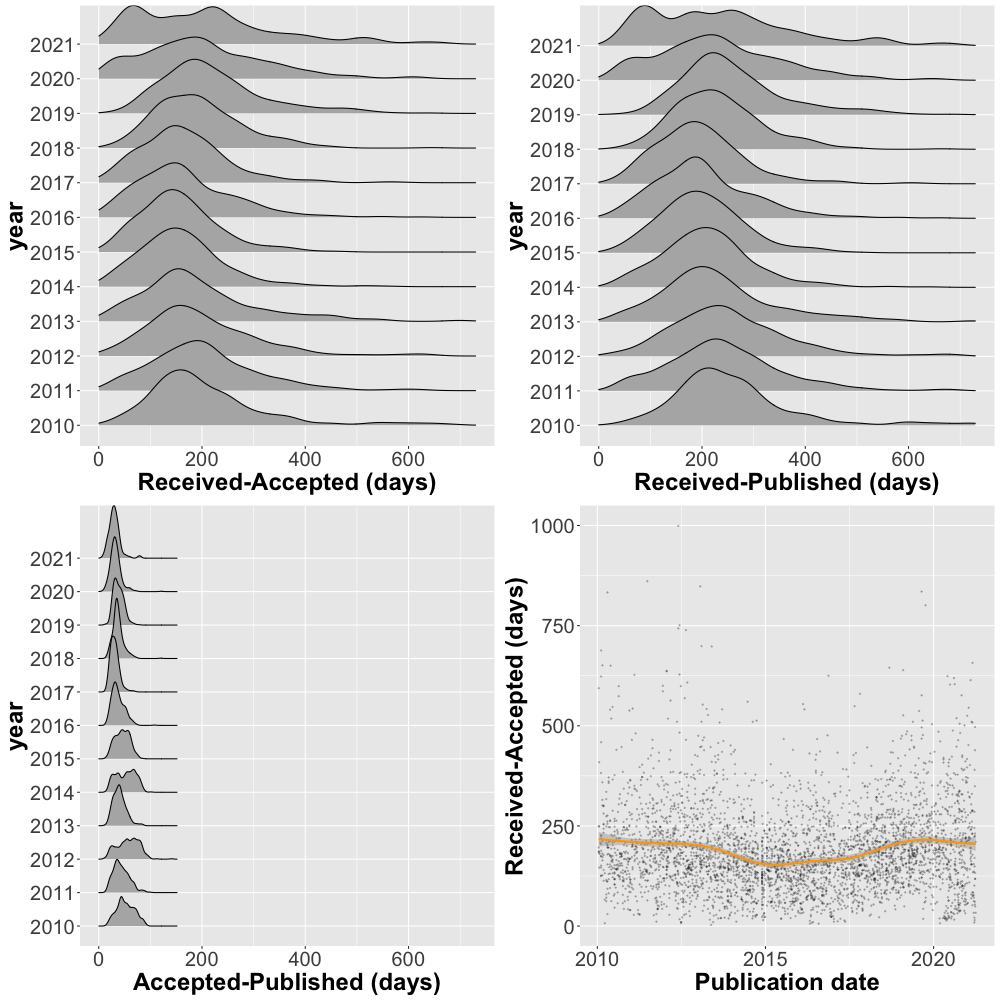
I am giving a talk next week and wanted to update some plots from an old analysis that previously featured on quantixed. The question is: how long does it take for a paper get published? The answer is complex (as previously discussed on quantixed), but we can at least find out using data from PubMed what journals declare as the time from when a paper is received to when it was published. The code is below and can be found here.

PublishingBioRxivLag TimesRstatsInformática y Ciencias de la InformaciónInglés
Publicado

When a preprint is uploaded to bioRxiv, it undergoes screening before it appears online. How long does it take for Affiliates to screen preprints at bioRxiv? tl;dr I used R to look at bioRxiv screening times. Even though bioRxiv has expanded massively, screening happens quickly (in about 24 h). I am a bioRxiv Affiliate – one of the people who does the screening. Preprints wait in a queue to be screened.

PublishingScienceASAPbioBioRxivCoronavirusInformática y Ciencias de la InformaciónInglés
Publicado

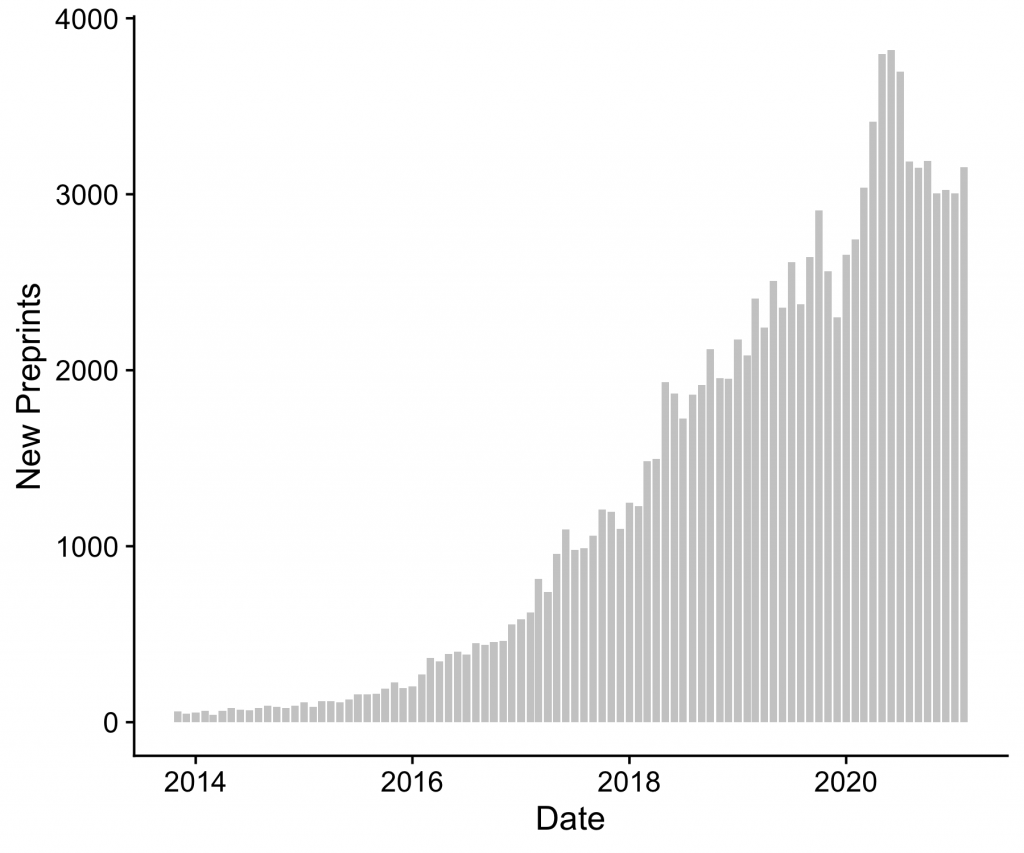
I’m posting this the morning after generating a graph, and it’s already out-of-date. During the worldwide COVID-19 outbreak, preprint servers such as bioRxiv and medRxiv have again shown that they are the most effective way of communicating science rapidly. A collection of all papers on COVID-19 deposited on these two servers is available here, and it is growing daily.