RTidyverseGgplotStatisticsBrmsSciences politiquesAnglais
Publié
Auteur Andrew Heiss
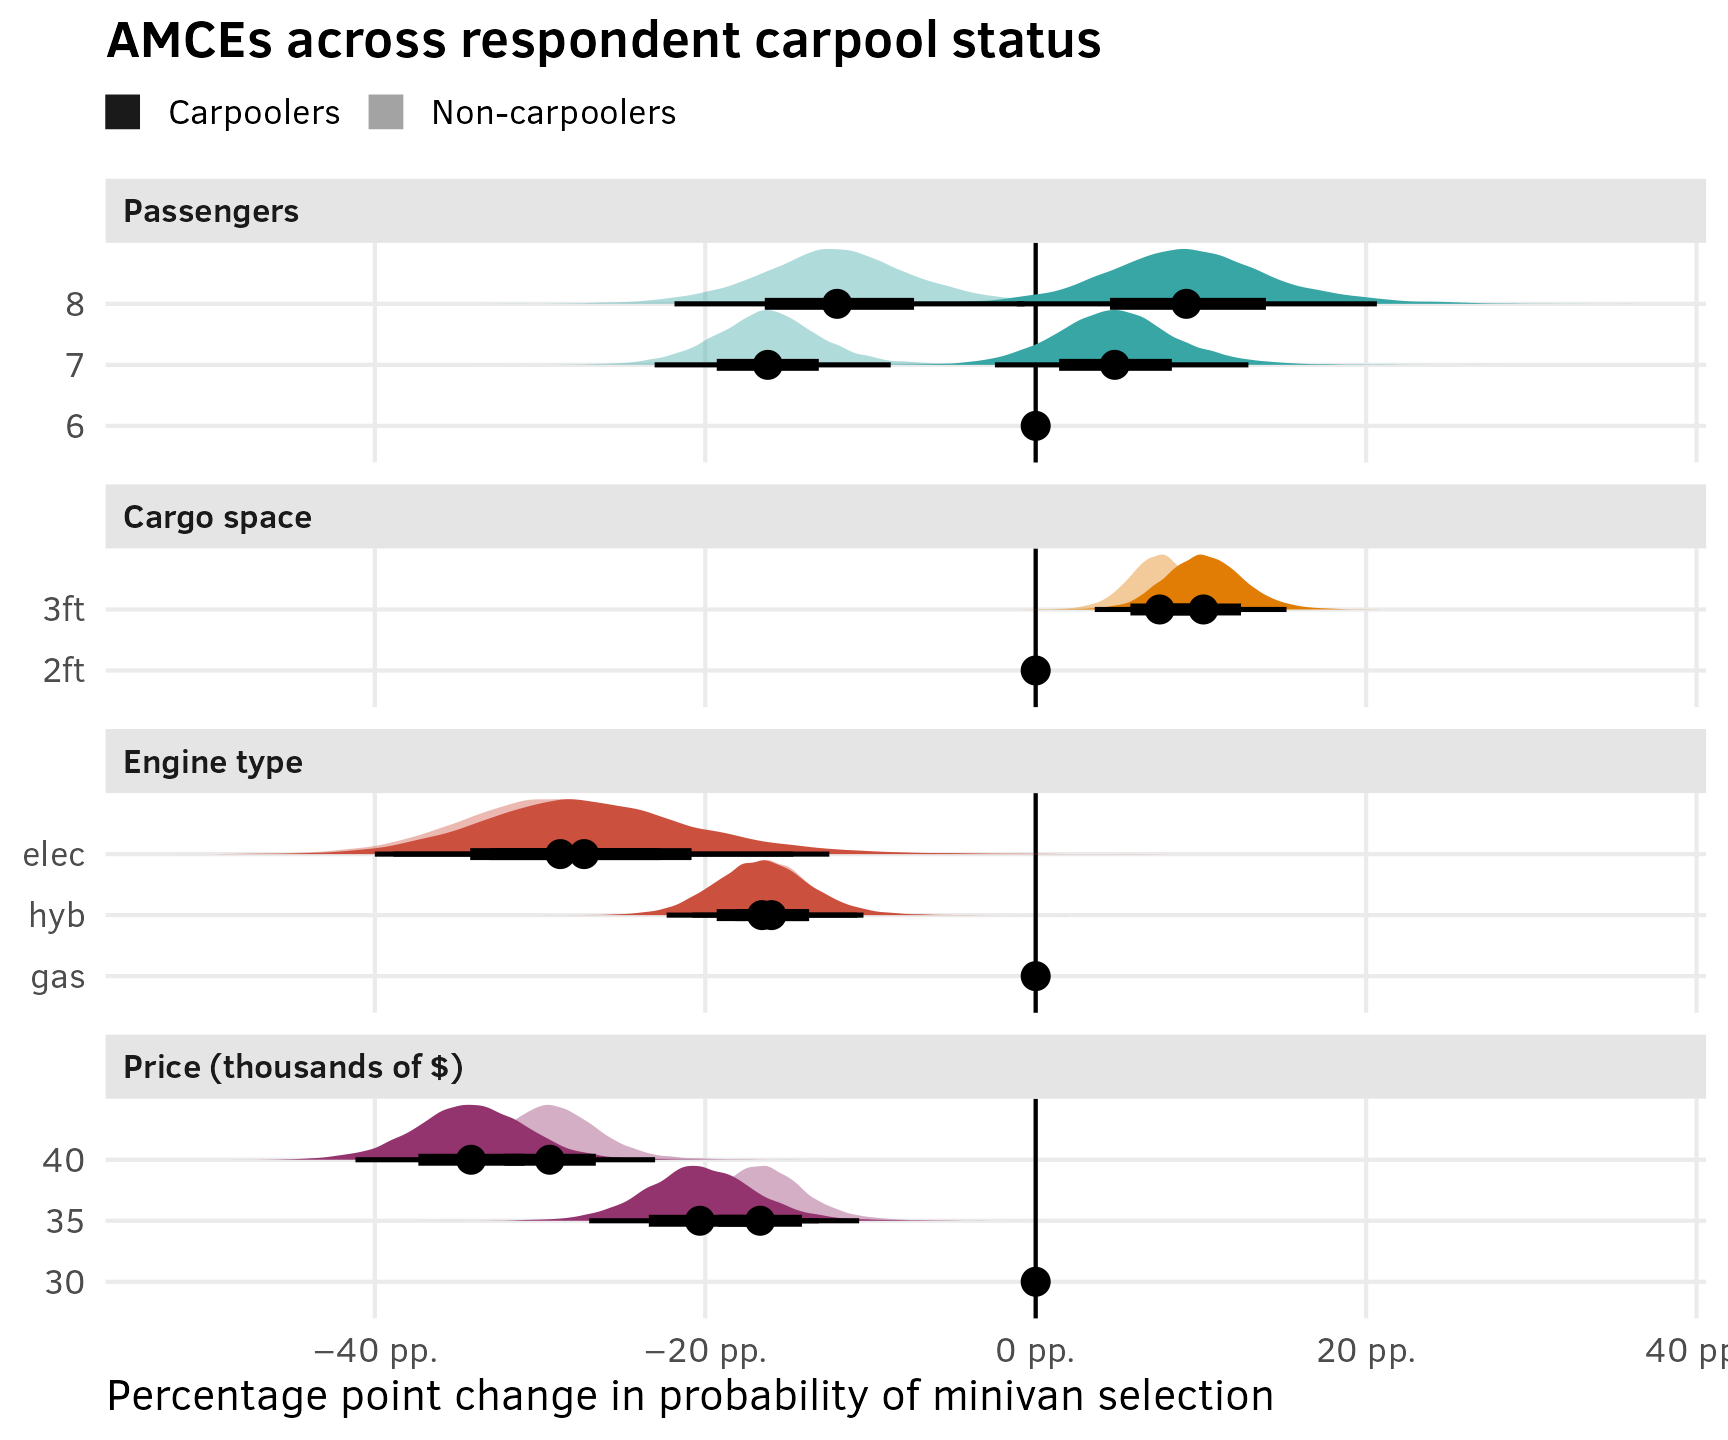
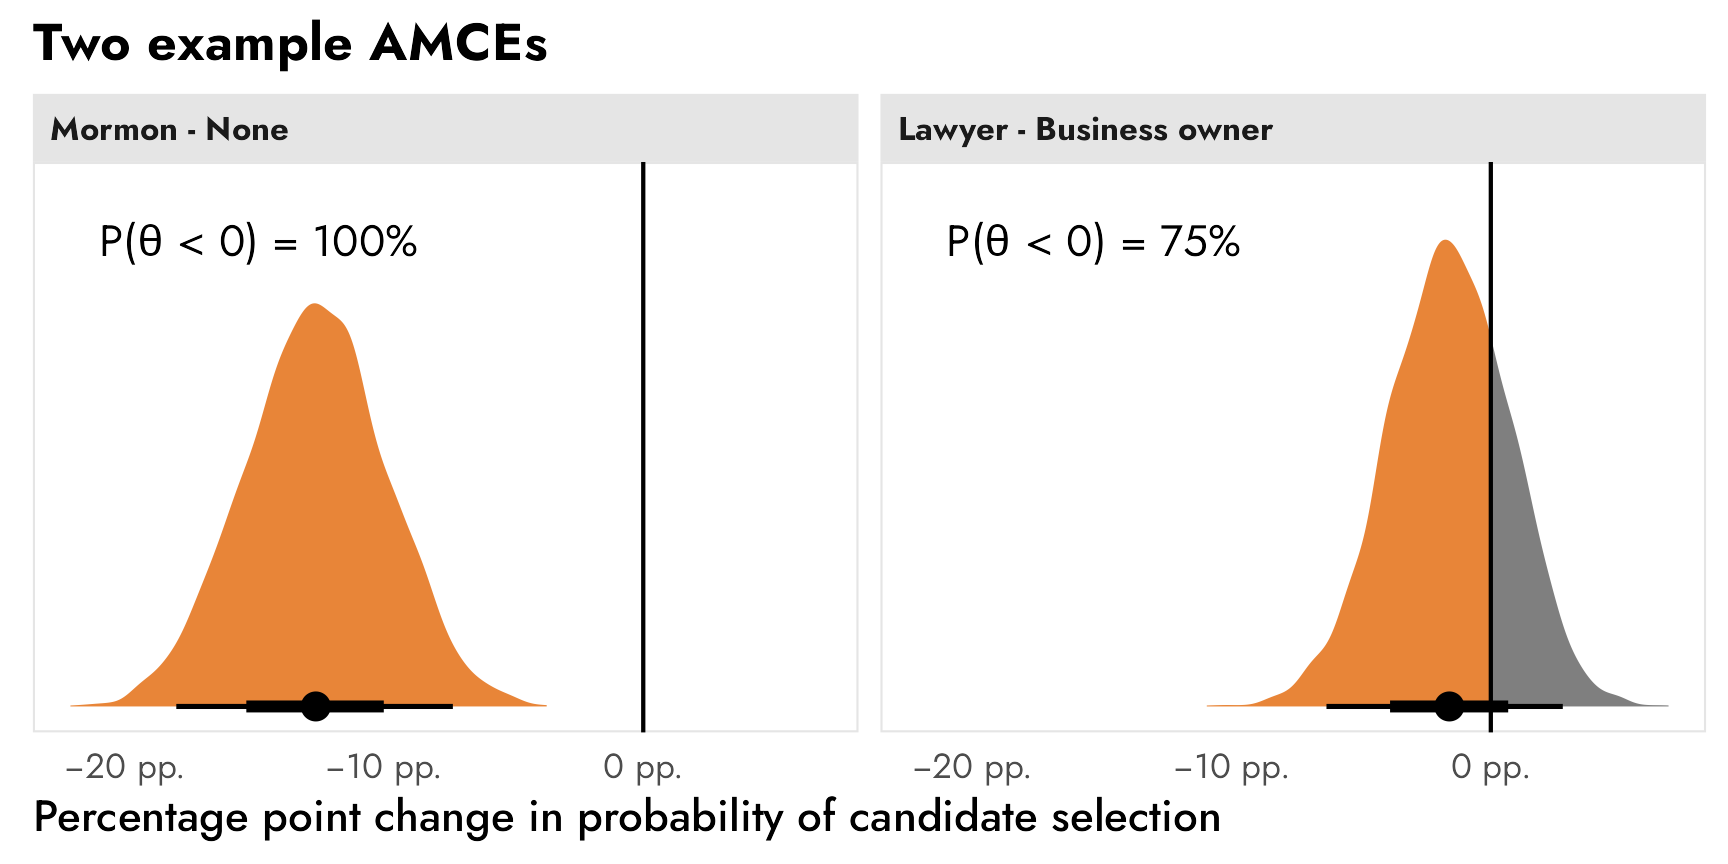
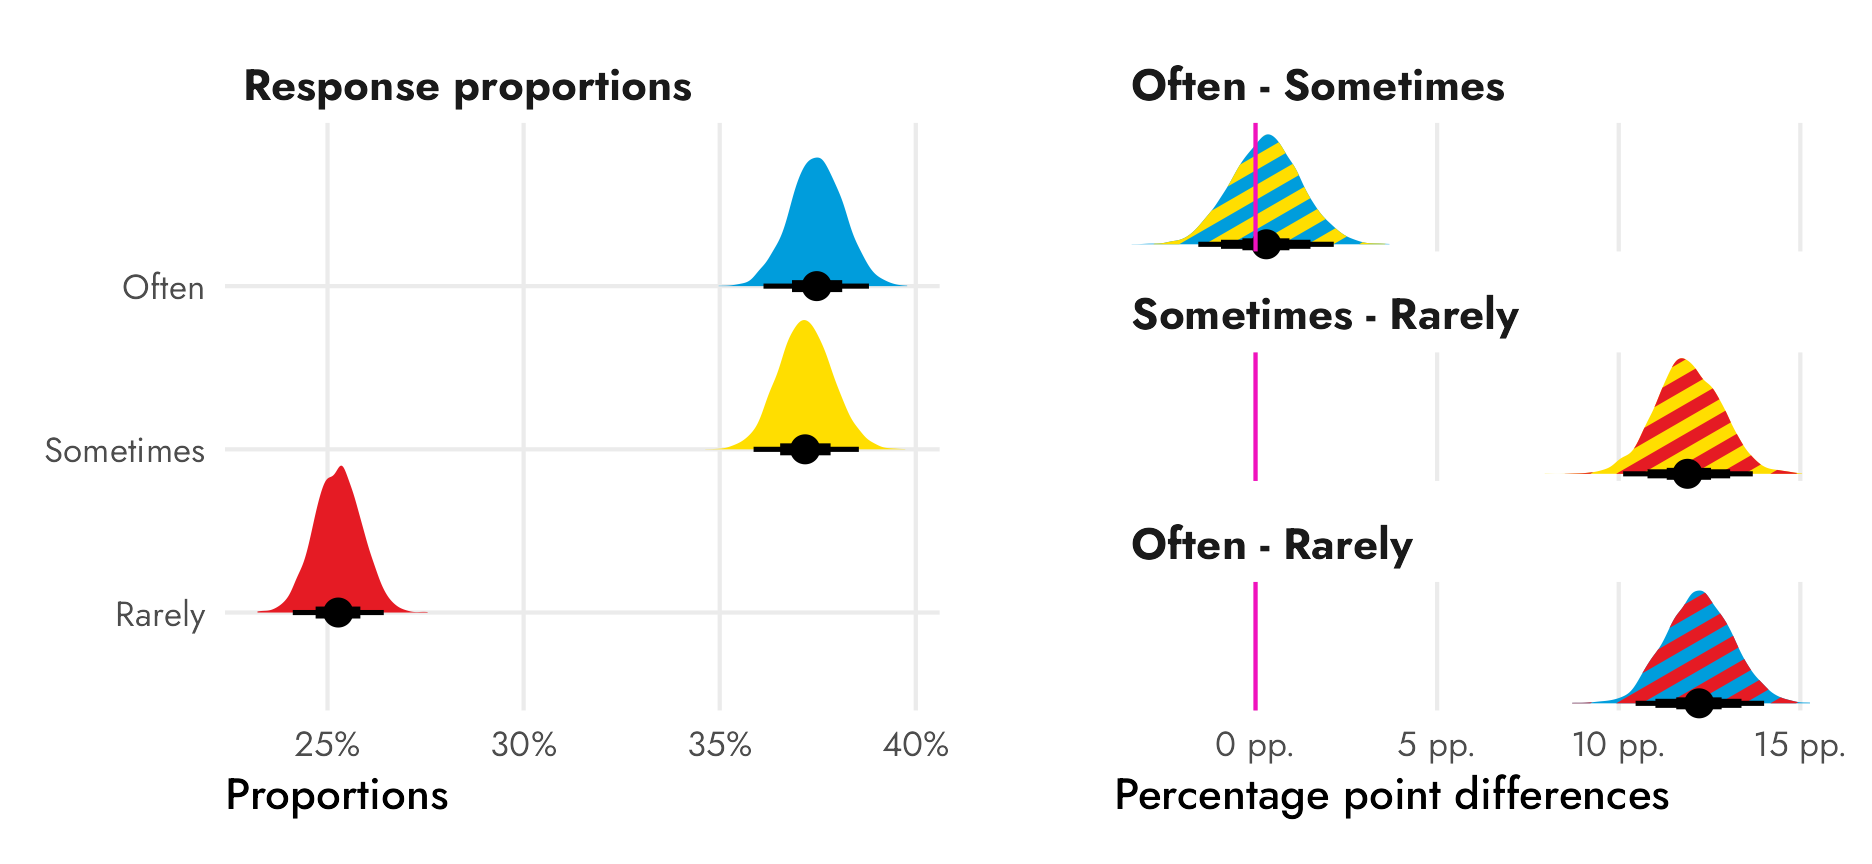
I recently posted a guide (mostly for future-me) about how to analyze conjoint survey data with R. I explore two different estimands that social scientists are interested in—causal average marginal component effects (AMCEs) and descriptive marginal means—and show how to find them with R, with both frequentist and Bayesian approaches. However, that post is a little wrong. It’s not wrong wrong, but it is a bit oversimplified.