tl;dr : Skip to complete example In one of my current research projects, I use Bayesian modeling (with Stan and rstanarm) and multiple imputation (with Amelia) to measure how international aid agencies change their funding allocations to countries that impose legal restrictions on NGOs.
Andrew Heiss's blog
(See this notebook on GitHub) tl;dr : Use the functions in broomify-amelia.R to use broom::tidy(), broom::glance(), and huxtable::huxreg() on lists of multiply imputed models. The whole reason I went into the rabbit hole of the mechanics of merging imputed regression results in the previous post was so I could easily report these results in papers and writeups.
(See this notebook on GitHub) Missing data can significantly influence the results of normal regression models, since the default in R and most other statistical packages is to throw away any rows with missing variables. To avoid unnecessarily throwing out data, it’s helpful to impute missing values. One of the best ways to do this is to build a separate regression model to make predictions that fill in the gaps in data.

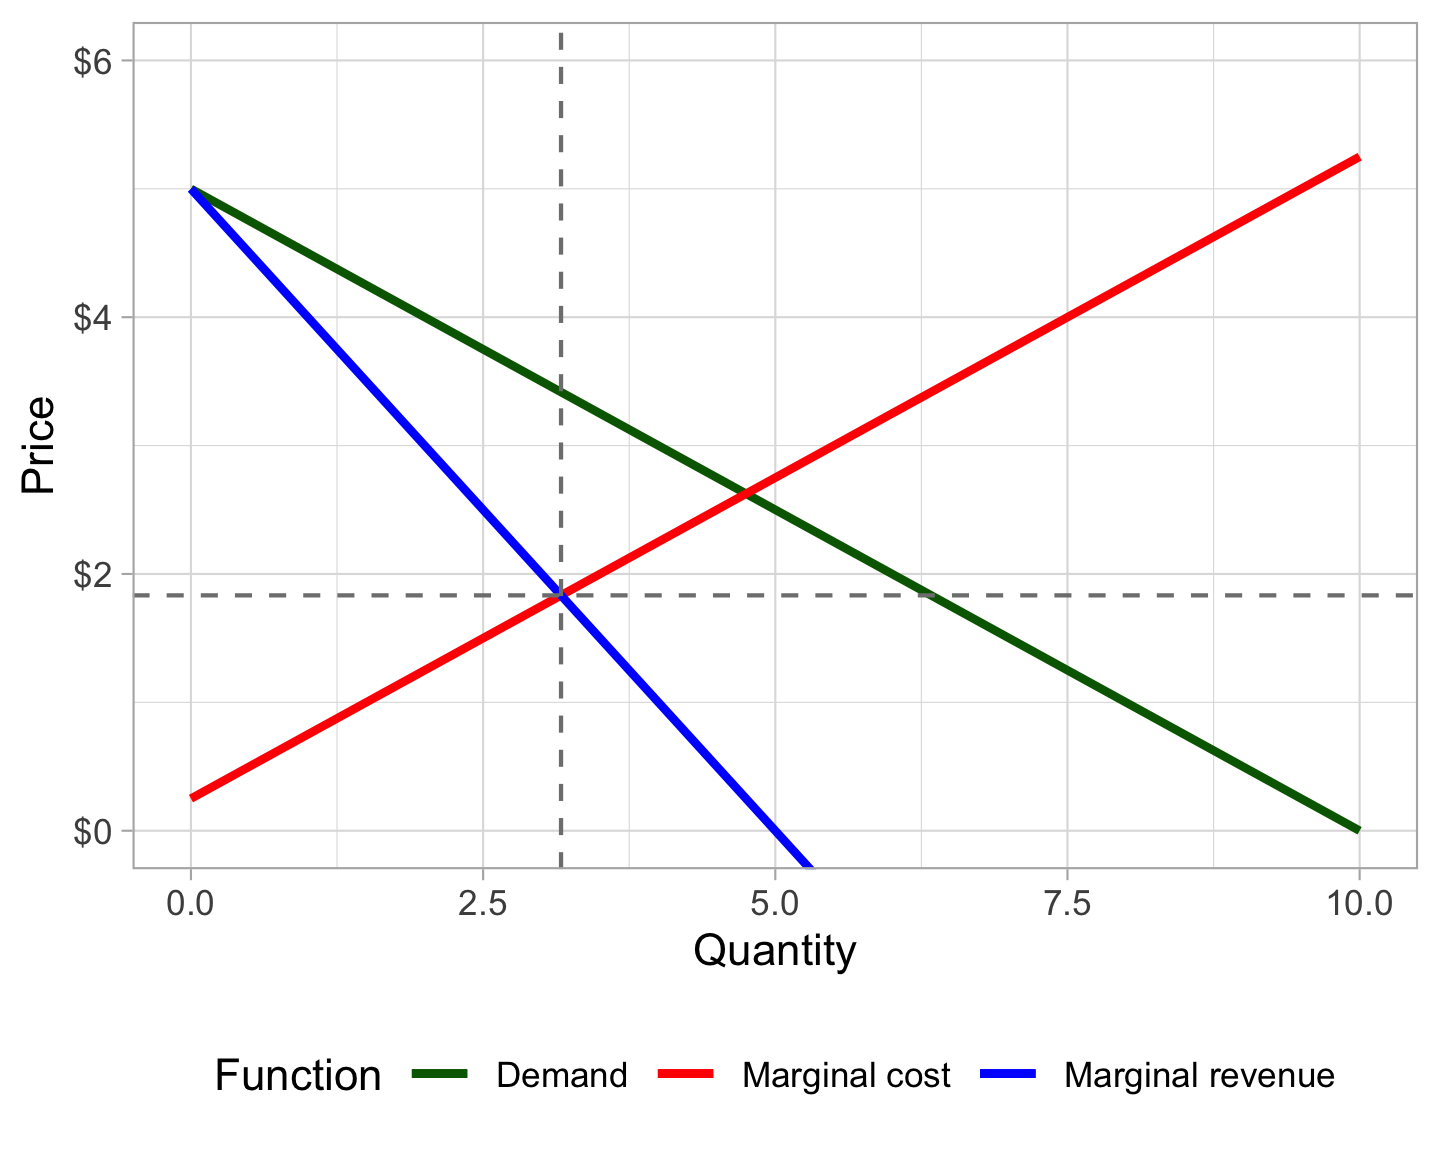
(See this notebook on GitHub) tl;dr : Use functions like Deriv::Deriv(), splinefun(), approxfun(), and uniroot() to do things with derivatives in R, both with actual functions and with existing empirical data A typical microeconomics problem involves finding the optimal price and quantity of a product, given its demand and cost across different quantities.

Note Skip to instructions for macOS or Windows R and ggplot can create fantastic graphs, but the default Arial/Helvetica font is too boring and standard.

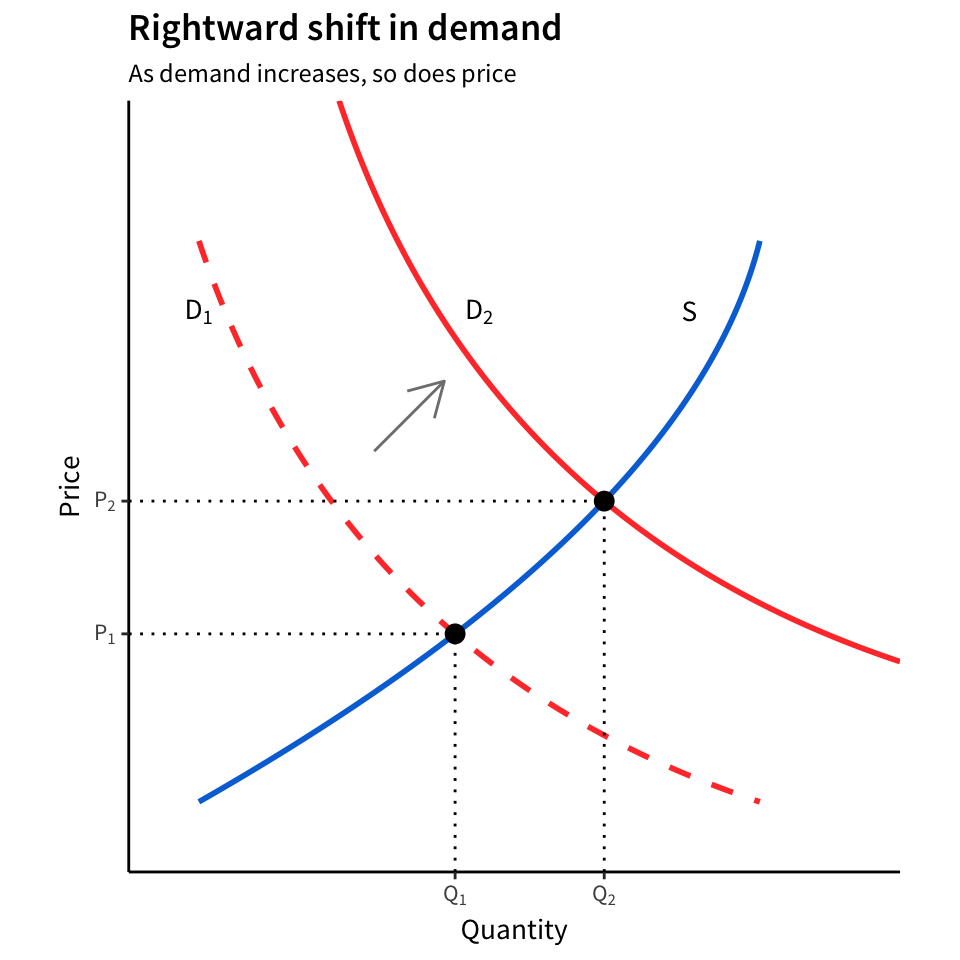
Tip This is now an R package named reconPlots. (Skip to the tl;dr complete example; see this mini project on GitHub) So far, teaching at BYU has been delightful. I’ve been using static course-specific websites for the two classes I’m teaching this semester—data visualization and telling stories with data—and it’s been fantastic. Everything is self-contained and automated and magic and I’m a huge fan of blogdown.