ComputingPublishingCellCOVID-19Lag TimesBiologieAnglais
Publié
Auteur Stephen Royle
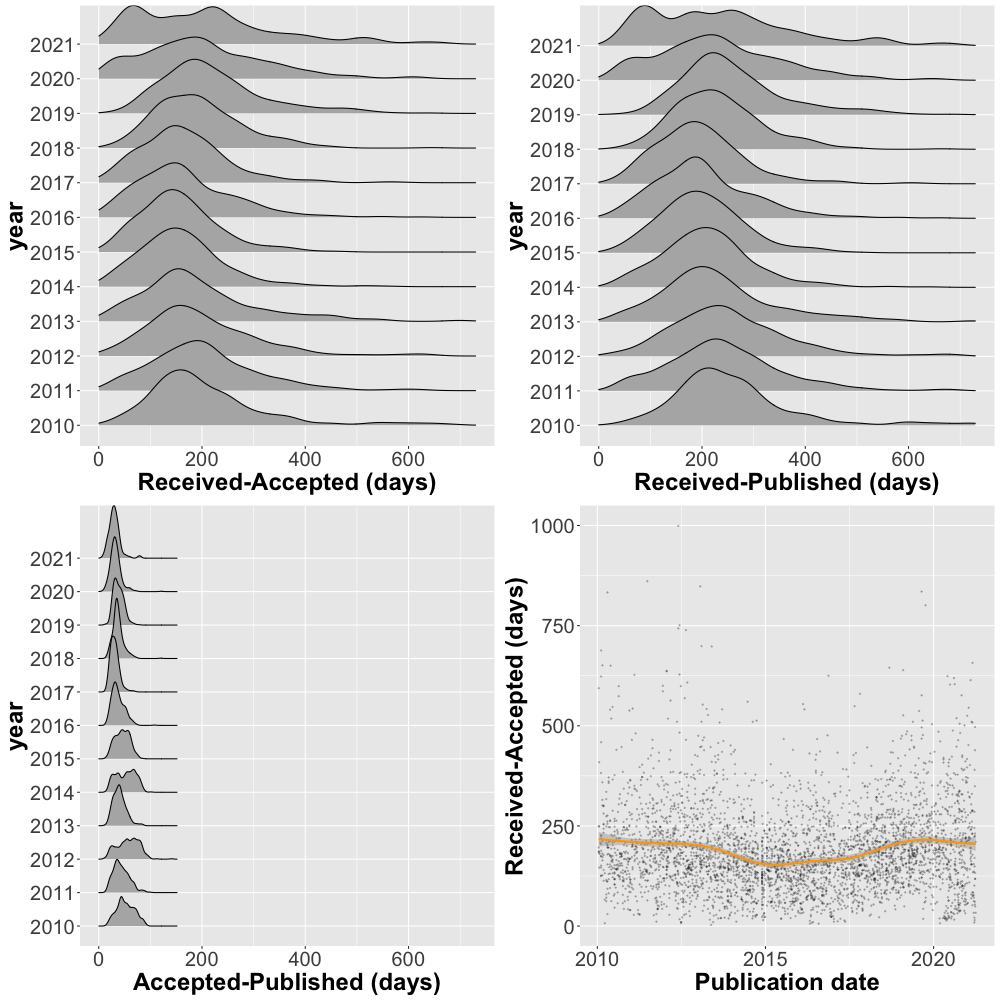
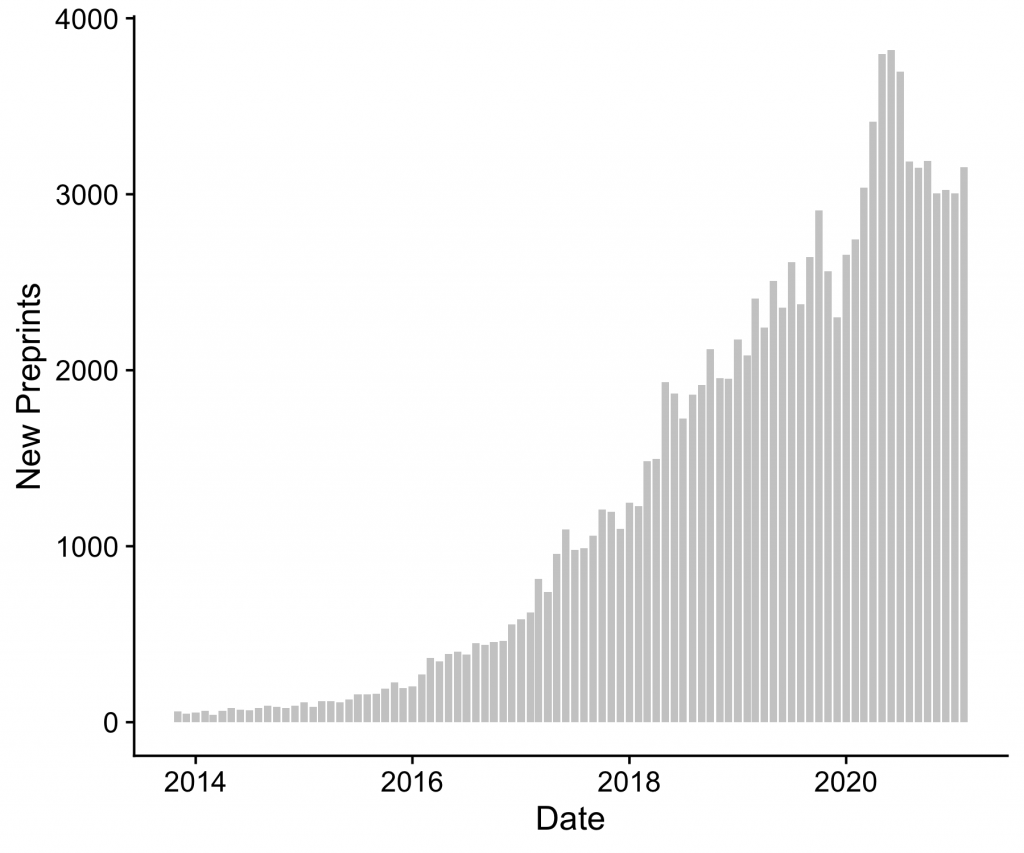
This post is an update of a previous analysis on quantixed. We have covered publication lag times – the time it takes for a paper go from submitted (received) to accepted and published – a lot on here. It is possible to look at lag times, in R using data from PubMed.