ComputingPublishingScienceCodeFigshareBiologieAnglais
Publié
Auteur Stephen Royle
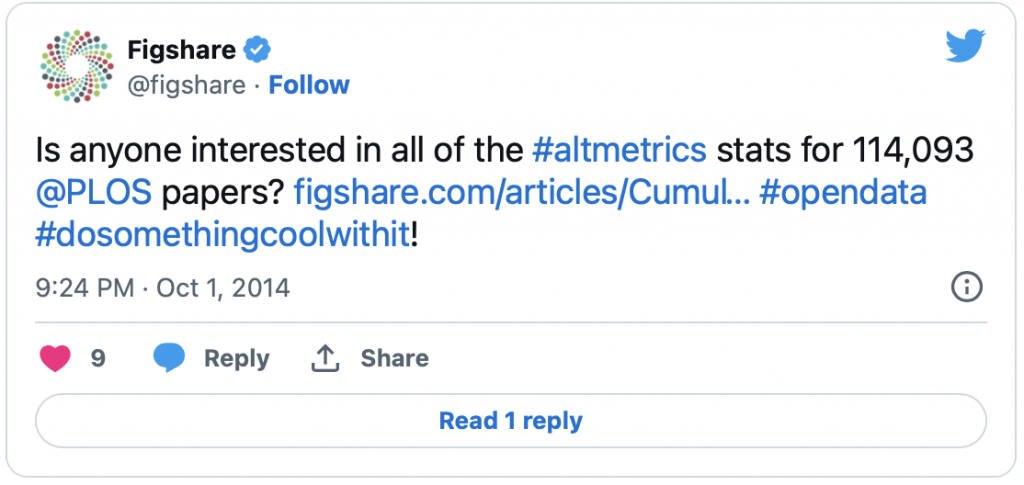
Last week, ALM (article-level metric) data for PLoS journals were uploaded to Figshare with the invitation to do something cool with it. Well, it would be rude not to. Actually, I’m one of the few scientists on the planet that hasn’t published a paper with Public Library of Science (PLoS), so I have no personal agenda here.