FunDatavizGarminGgplotGpxBiologieAnglais
Publié
Auteur Stephen Royle

2022 was my best year for running to date. In 2021, my goal was to run 2021 km. For 2022, I wanted to see if I could run 2500 km and also to run 50 HM-or-more distance runs.
2022 was my best year for running to date. In 2021, my goal was to run 2021 km. For 2022, I wanted to see if I could run 2500 km and also to run 50 HM-or-more distance runs.
Another post looking at Twitter data in R. It follows this one and this one. I wanted to look again at my tweeting frequency over the 12 years on Twitter, but this time do it in a calendar view. Something like a GitHub commit calendar would be perfect.
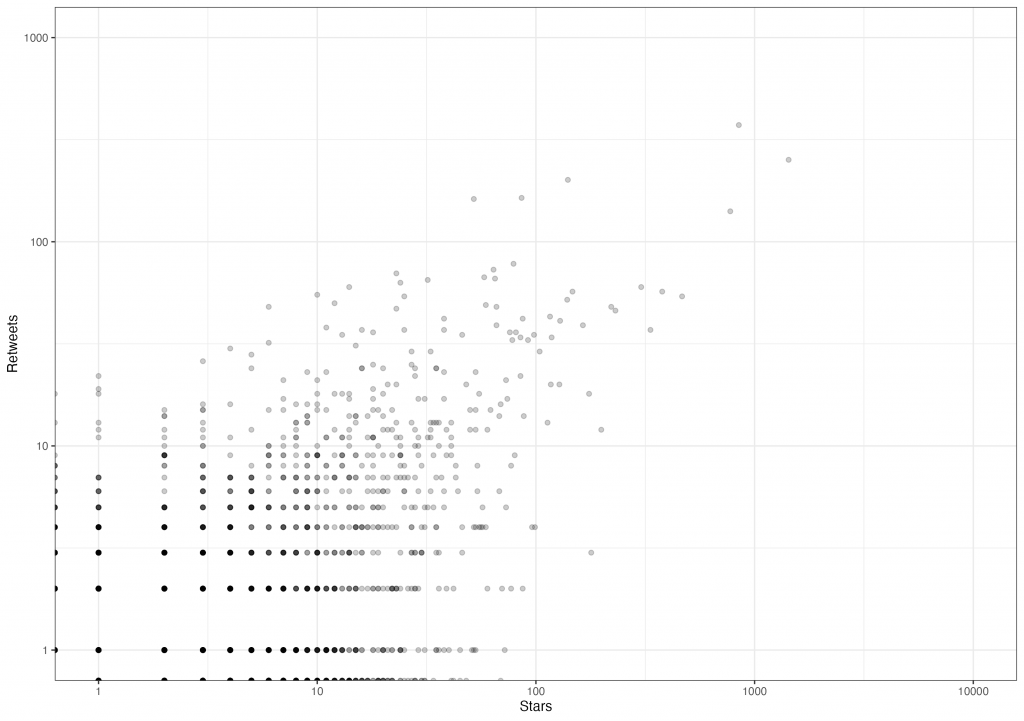
Another post about my time on Twitter. I will post the code in a separate post so that the R-bloggers don’t syndicate this one, which is about music. In my time on Twitter I occasionally posted about what I was listening to. I did this with a #NowPlaying hashtag.

Please consider this a “supplementary analysis” to my previous post looking at the frequency of tweets from my personal account over the last 12 years.

At the time of writing, I have essentially left Twitter. It was a fun ride and without going into what’s happening there now, this is a good opportunity to look at my 12 years on the platform. Early in November, I downloaded my data and locked my Twitter account.
There’s plenty of guides to getting going on Mastodon, aimed at people leaving Twitter.

There are lots of ways for runners and cyclists to analyse training data. A key question most fitness enthusiasts want to know is “how am I doing?”. “How you are doing” is referred to as form. Unsurprisingly, form can be estimated in many ways.

By 30th September 2022, I had clocked up a total of over 2000 km of running in 2022. This milestone was a good opportunity to look at how I got to this point. The code is shown below. First, we can make a histogram to look at the distance of runs.

Here is a summary of the info I gleaned from asking for recommendations for the best human cell line. These were my criteria: For context, we currently use a number of human cell lines in the lab: HeLa, RPE1, HCT116, SKOV3; as well as many others in the past: HEK293, DLD-1, U2OS.
I recently did a webinar for ASCB called “From Microscope To Figure“. For posterity, I am re-posting the webinar here with some additional info. The webinar Useful links There was a request to share the tutorial I showed (in short form) to making montages in ImageJ.
Sometimes an update causes a chain reaction which borks a system. Here are some notes on how I fixed a SMTP mail issue on my Raspberry Pi camera project.