Data VisualizationDroughtTidyverseGgplot2ShapefilesSozialwissenschaftenEnglisch
Veröffentlicht in Data Art & Science Blog
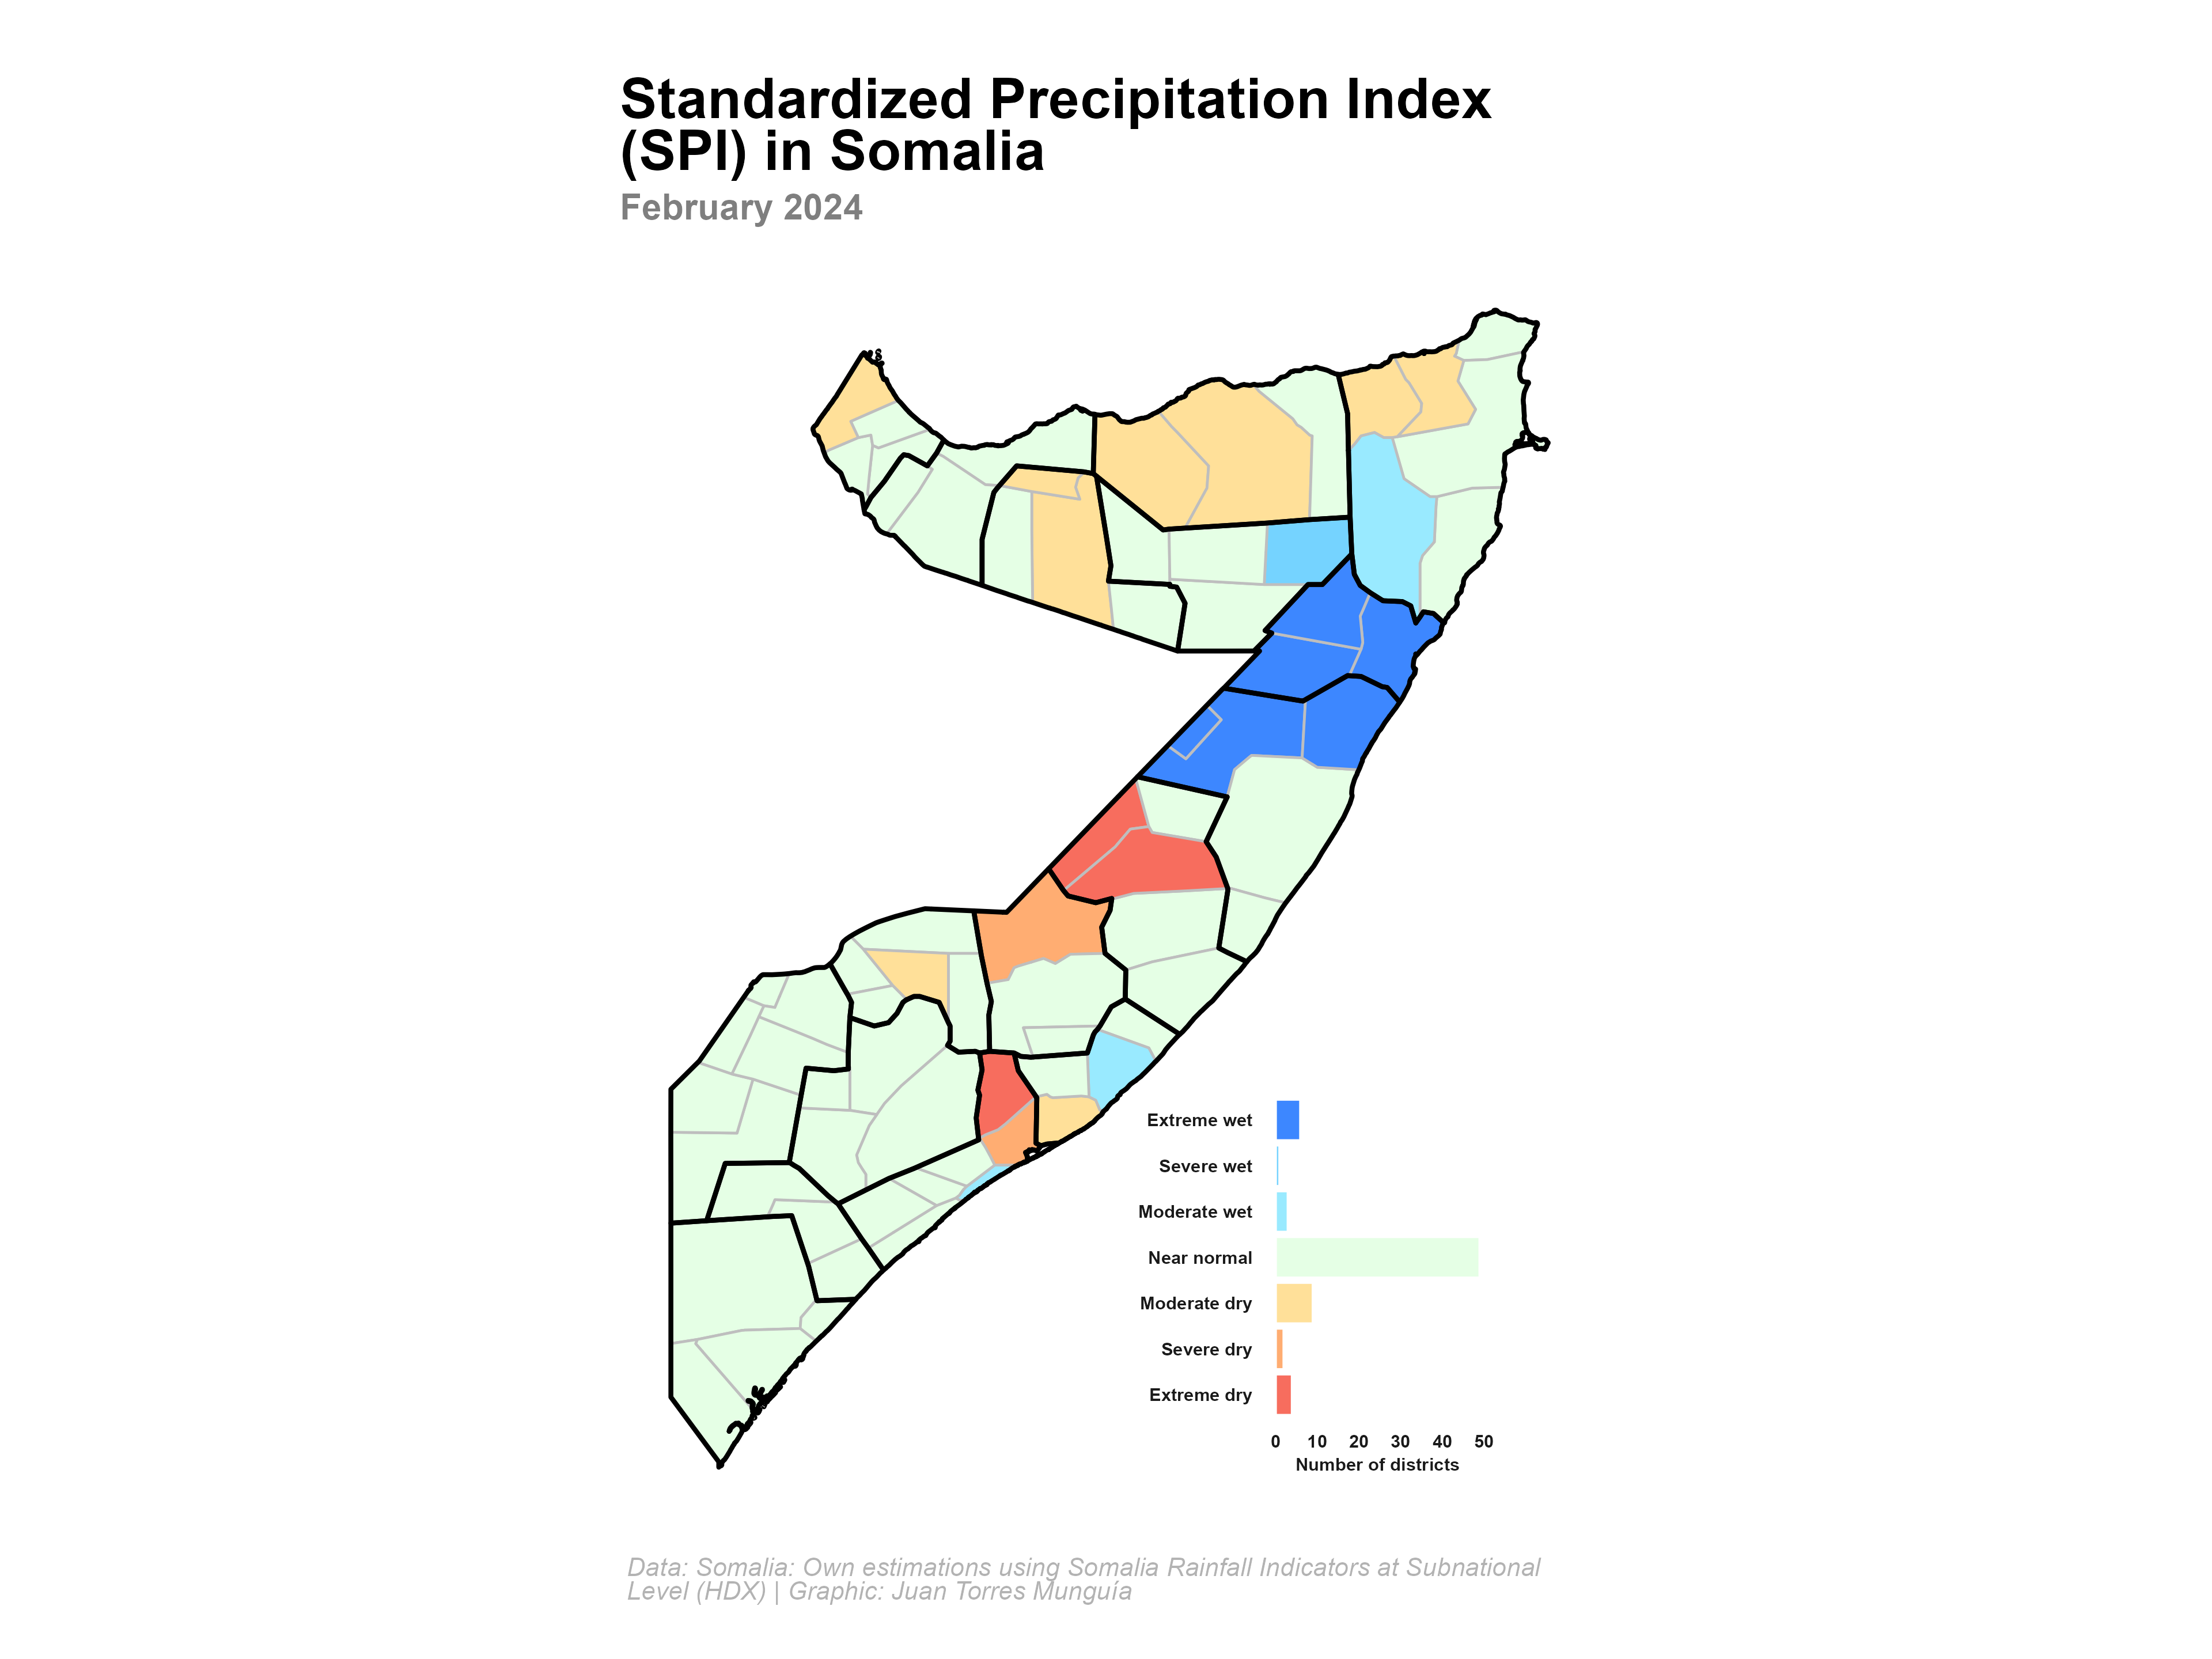
Previously, in Part 1 of this tutorial, we calculated the Standardized Precipitation Index (SPI) for different time scales using the {SCI} package in R. Now, we will map the SPI values for the districts of Somalia using {sf} and {ggplot2} packages in R.