Data VisualizationOfficial StatisticsMexicoHousehold SurveysENVIPECiencias SocialesInglés
Publicado in Data Art & Science Blog
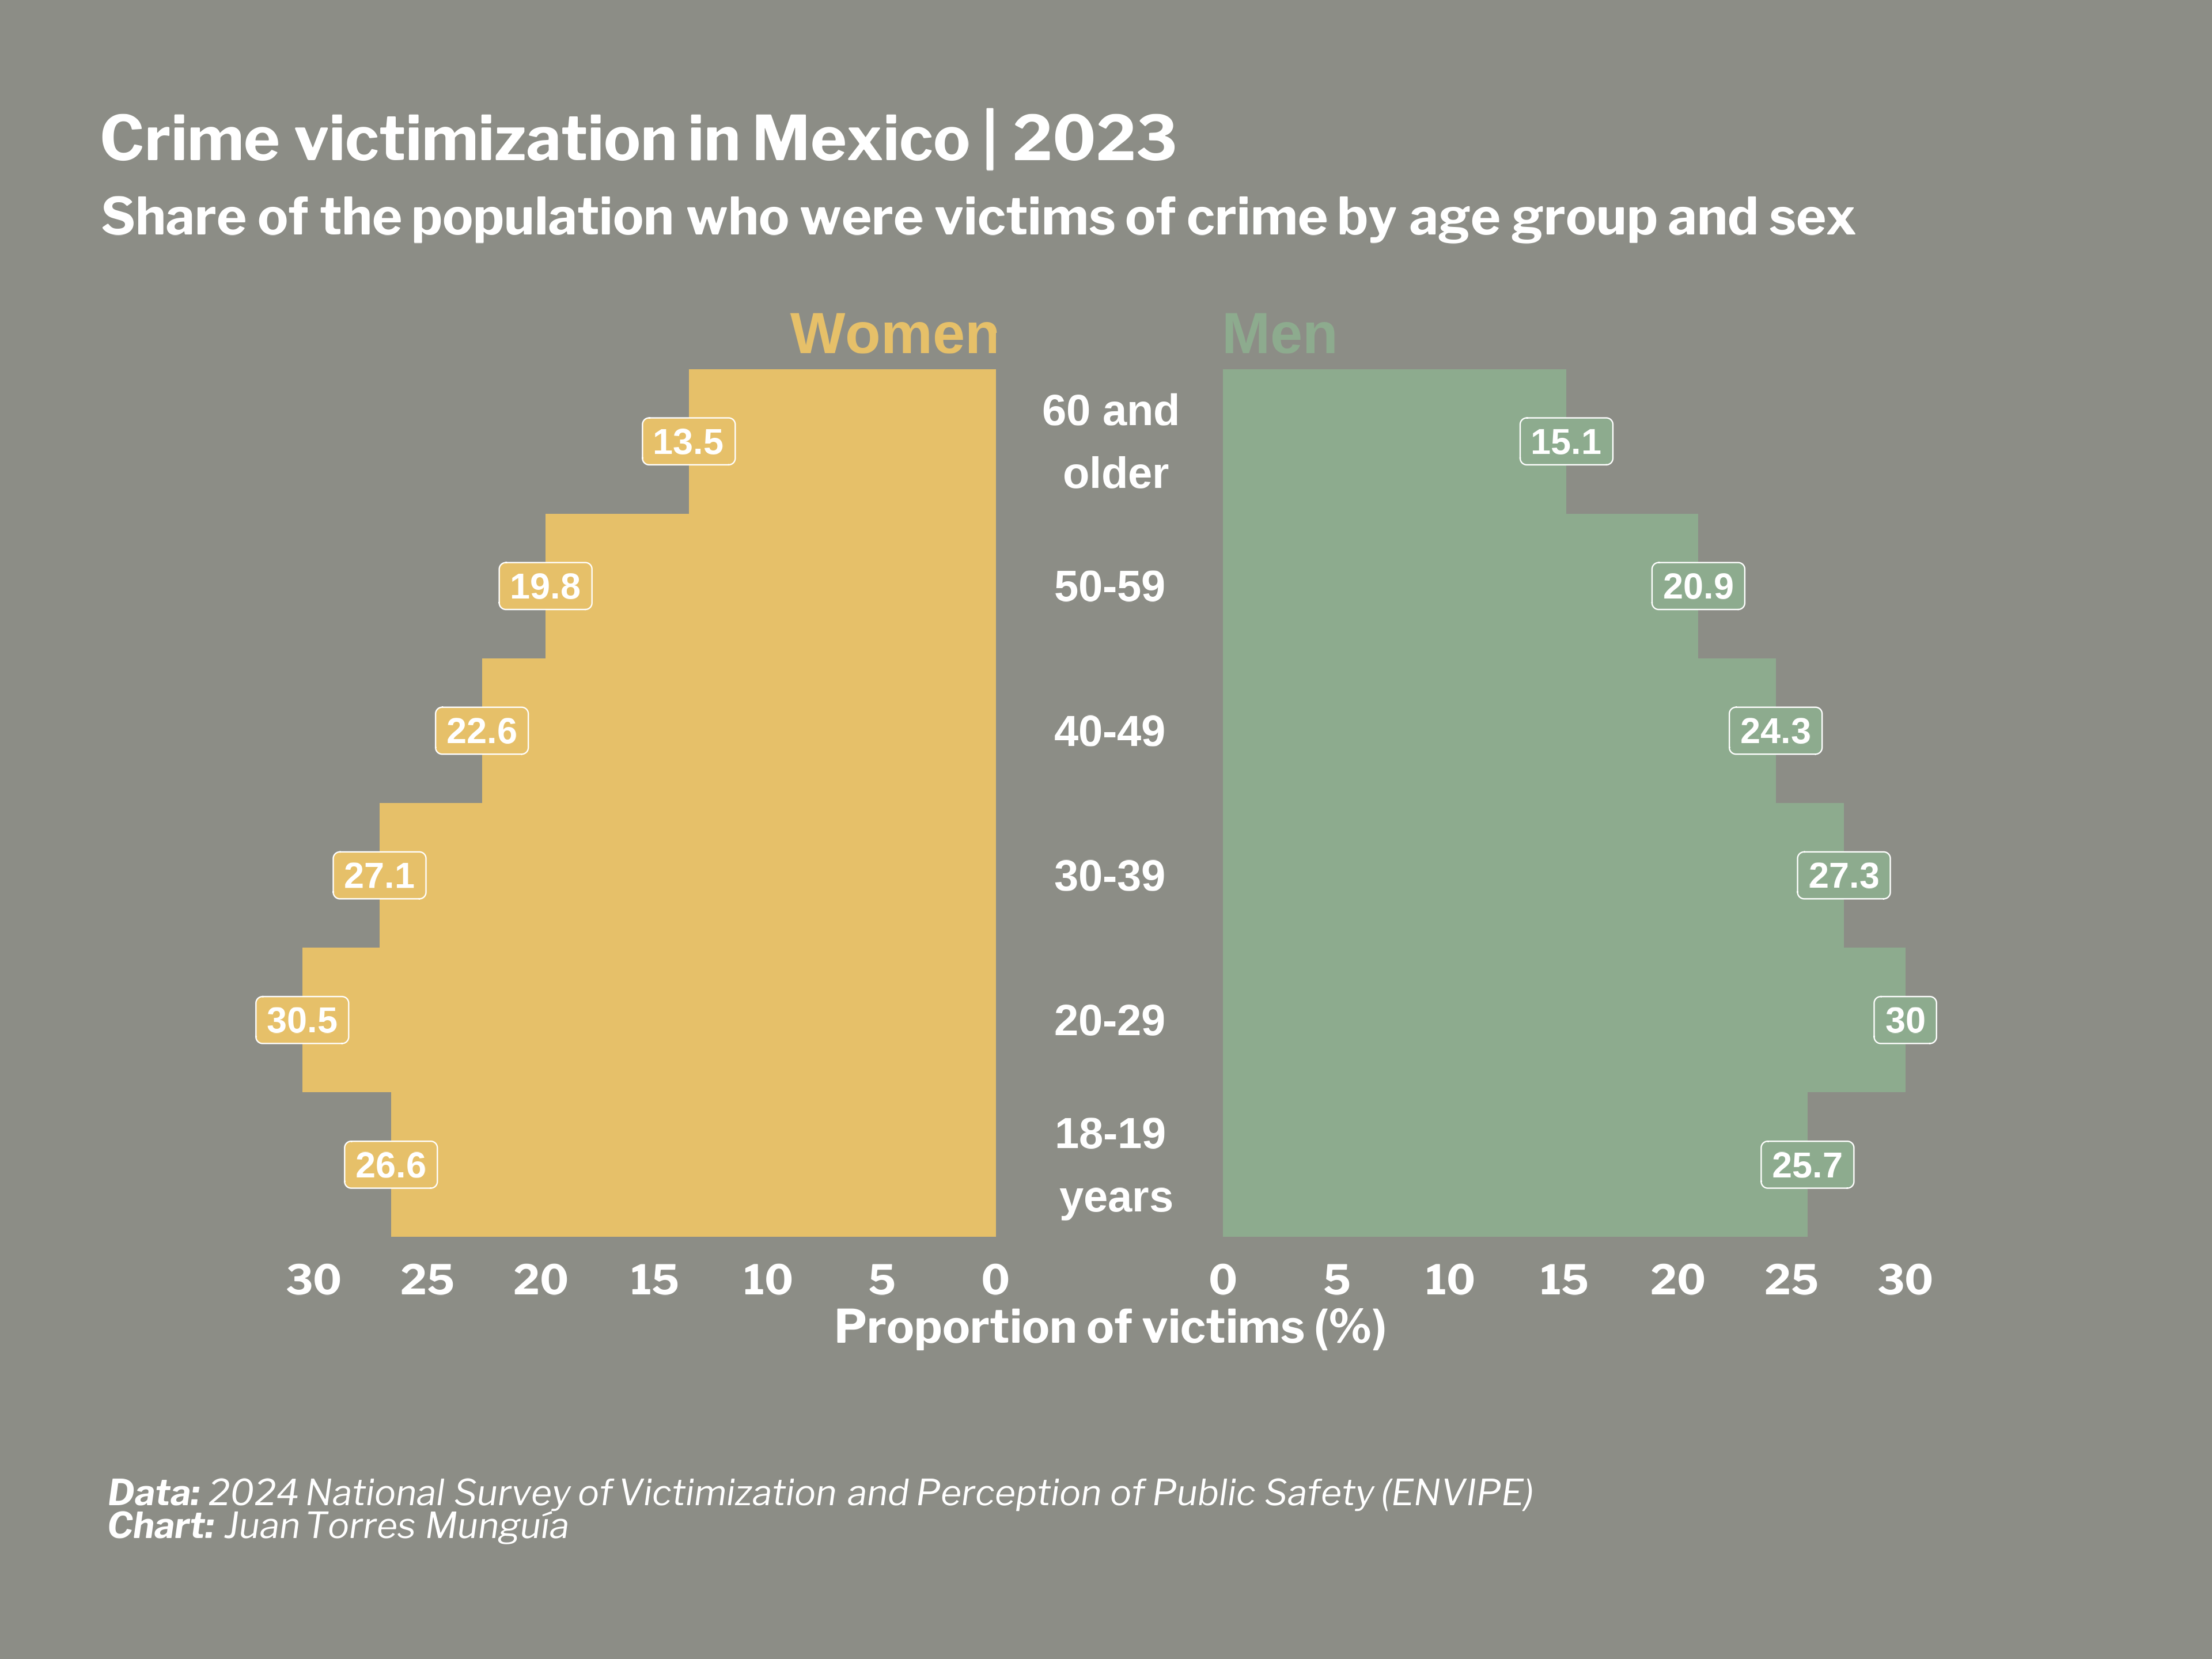
Population pyramids are a powerful way to visualize demographic data, especially when analyzing age and sex patterns. In this post, I will elaborate a population pyramid using the {ggplot2} package in R, specifically focusing on crime victimization data from Mexico’s National Survey of Victimization and Perception of Public Safety ( Encuesta Nacional de Victimización y Percepción sobre Seguridad Pública , ENVIPE).